
It's time to keep an eye on the euro

Key points
- The Euro has traded sideways since the start of 2023
- Price action has been extremely weak in the last month
- The annual seasonal trend for Euro now suggests the potential for weakness in the near-term
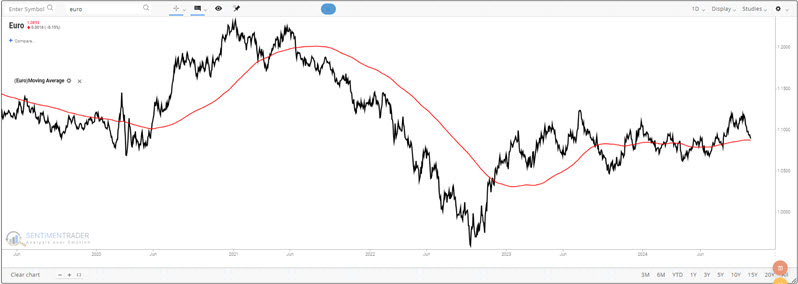
Euro showing recent weakness in a trading range
The chart below displays a long-term price action chart for Euro futures. Note that the Euro has been stuck in a trading range since January 2023. Price has also been weak in recent weeks and is threatening to break back below the 200-day moving average.
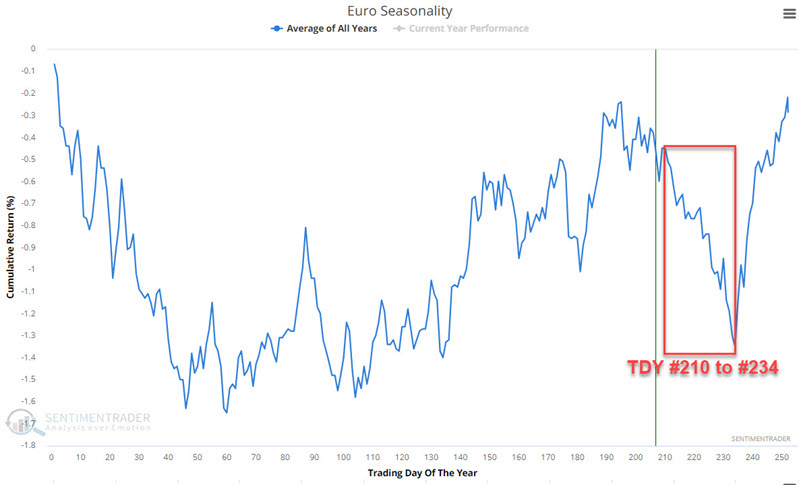
Seasonality enters a period of weakness
The chart below displays the annual seasonal trend for Euro futures. Note that it will soon enter a period of typical seasonal weakness that extends from Trading Day of Year #210 to TDY #234. For 2024, this period extends from 2024-10-18 through 2024-11-21.
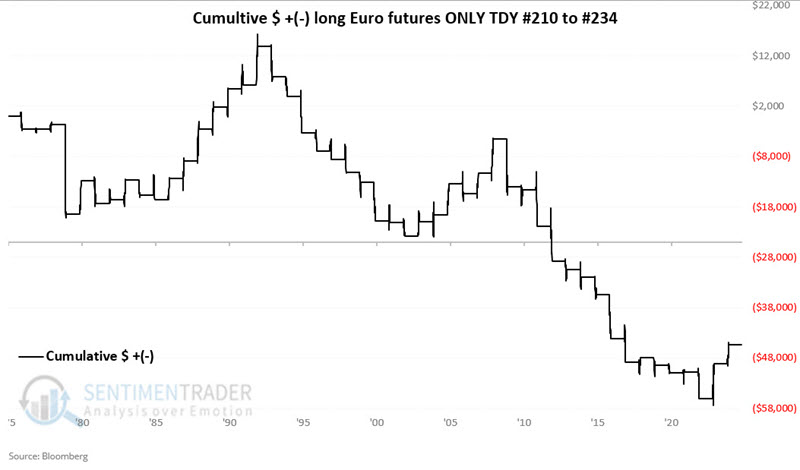
The chart below displays the hypothetical $+(-) achieved by holding a long position in Euro futures only during the unfavorable TDY #210 to TDY #234 period, every year starting in 1975.
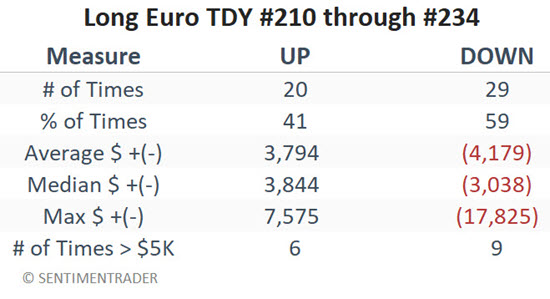
The table below summarizes annual results during unfavorable periods.
Zeroing in on presidential election years
2024 is a presidential election year in the U.S. There is an interesting quirk involving the Euro's TDY #210 to #234 period in presidential election years. The chart below displays the hypothetical $+(-) achieved by holding a long position in Euro futures only during the TDY #210 to TDY #234 period, only during the presidential election years that started in 1976.
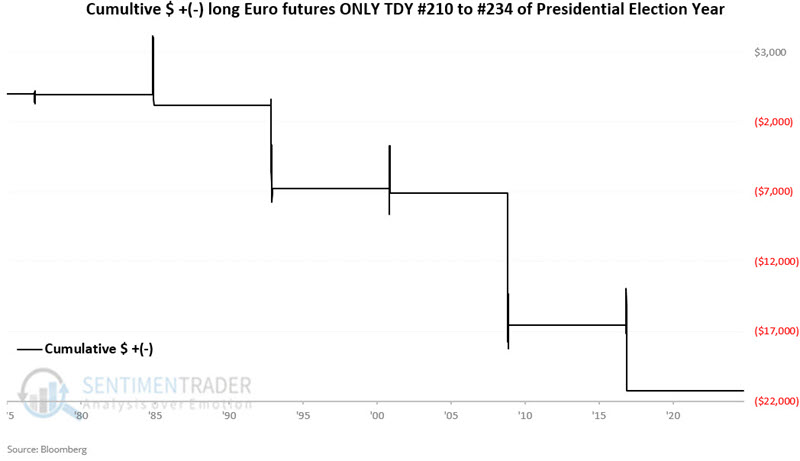
The table below summarizes the results.
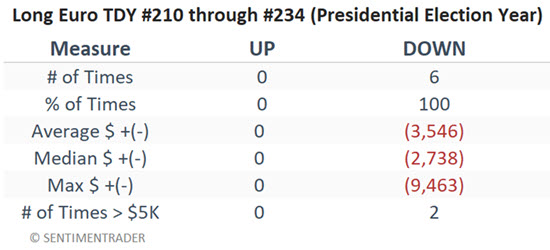
There are a few caveats to note. First, there are only six data points, so it is risky to draw any concrete conclusions. Raising the "correlation is not causation" argument is also more than fair. Finally, the most important thing is not to blindly assume that the Euro will trade lower in the weeks ahead and to throw caution to the wind.
An ETF alternative for non-futures traders
Traders who wish to play the Euro market but do not want to trade futures contracts can trade shares of the Invesco CurrencyShares Euro Trust (ticker FXE), an ETF designed to track the price of the Euro.
What the research tells us…
So, is the Euro destined to decline starting after October 18th? Not at all. As always, it is essential to remember that seasonality is not a roadmap, only an average of what has happened in the past. That said, the odds seem to favor continued weakness given the Euro's history during this period during previous presidential election years. In any event, the message right now regarding Euro seasonality is two-fold: 1) Traders playing the long side should consider taking profits or maintaining a relatively tight trailing stop, and 2) Traders should now start looking for opportunities to play the short side.