
Its time to keep an eye on technology and platinum

Key points
- Seasonality is not a roadmap to what "will" happen but rather simply an average of what has happened in the past
- That said, when price action and seasonality align, significant opportunities often arise
- Two "shiny objects" - the technology sector and platinum (the metal) - are entering periods that demand investors attention
Technology has been the place to be
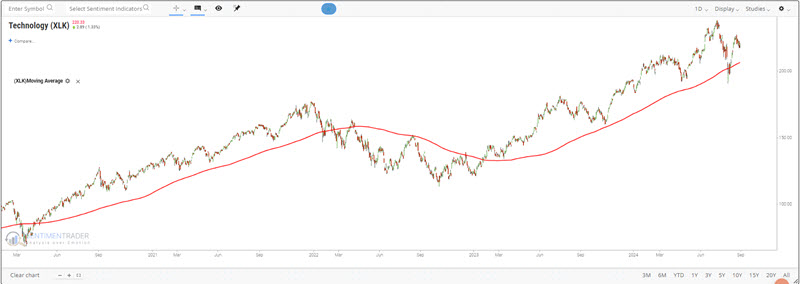
From its October 2022 low to the July 2024 high, the Technology Select Sector SPDR Fund ETF (ticker XLK) gained over 110% (versus roughly 62% for the S&P 500). From the March 2020 low to the July 2024 high, XLK gained almost +250% versus 158% for SPX. Undisputedly, technology has been the place to be for performance.
Seasonality is a short-term headwind
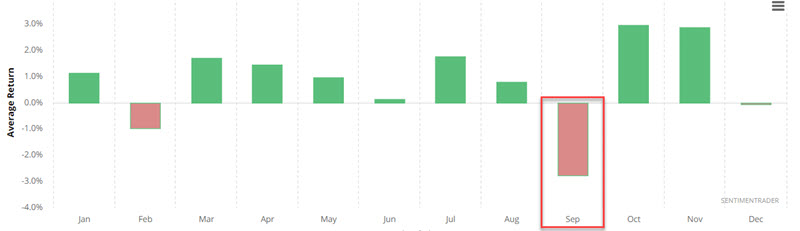
The chart below displays the average monthly performance for ticker XLK since it started trading in 1998. The key thing to note is that September has been XLK's worst performing month (February is the only other month to show an average loss).
The chart below displays the annual seasonal trend for ticker XLK.
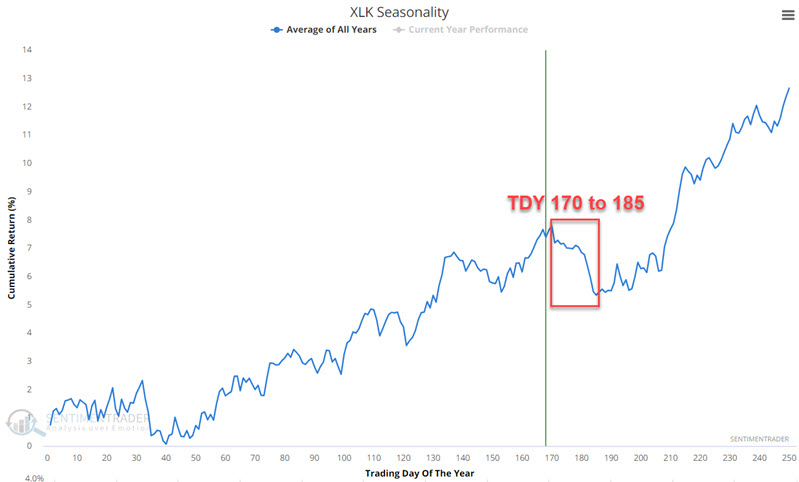
Note that an unfavorable period extends from Trading Day of Year (TDY) # 170 through TDY #185. For 2024, that period extends from the close on 2024-09-04 through 2024-09-24.
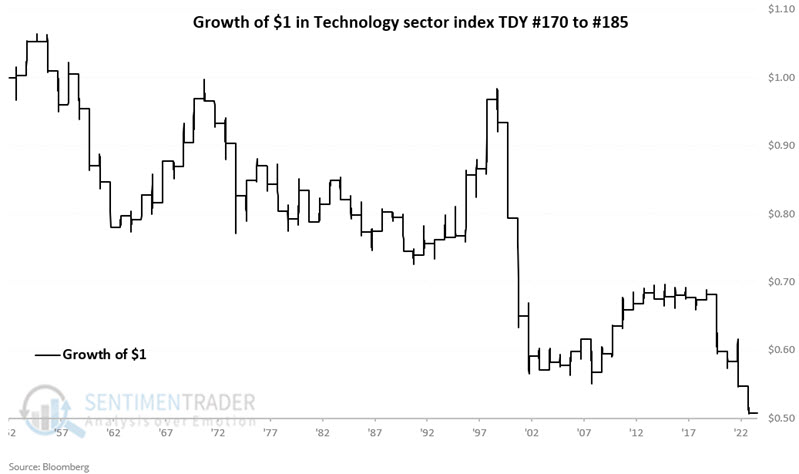
The chart below displays the hypothetical growth of $1 invested in XLK only during this period since 1999.
The table below summarizes XLK's performance during this period.
There are a few ways to look at the results displayed above. On the one hand, it should be noted that XLK showed a gain 46% of the time during the TDY #170 to #185 period. So, no assumption should be made that XLK is automatically doomed to decline in the weeks ahead. On the other hand, the real question for investors and traders is, "Does it make sense to step away from (or hedge) this sector in the near term?"
Platinum enters a period of serious seasonal weakness
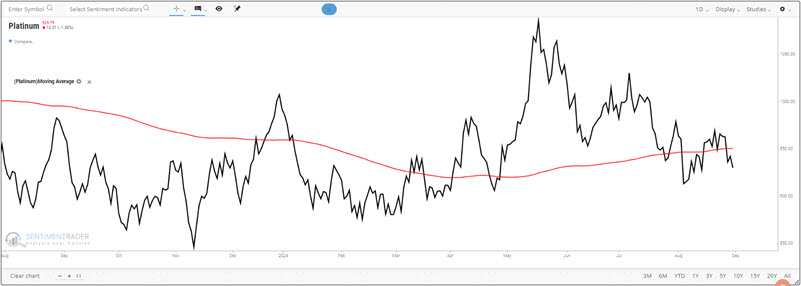
Speaking of "shiny objects," the precious metal platinum is entering a period of often serious seasonal price weakness. Seasonality is NOT a roadmap of what will happen but merely an average of what has happened in the past. It is generally best to pay attention to seasonality when seasonality and price action align. The chart below shows that platinum futures have been in a significant downtrend since peaking in May 2024 and are now back below their 200-day moving average.
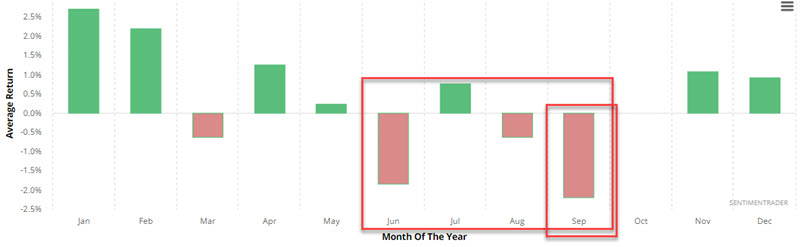
The chart below displays the average monthly performance for platinum futures since 1987. Note that the June through September period's historical performance correctly foreshadowed the post-May peak weakness seen in the chart above. Also, September has been the weakest month historically.
The chart below displays the annual seasonal trend for ticker platinum futures.
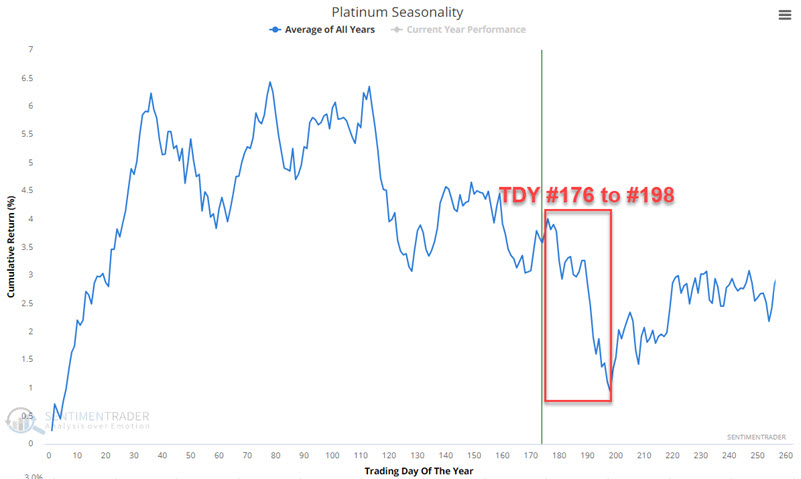
Note that an unfavorable period extends from Trading Day of Year (TDY) # 176 through TDY #198. For 2024, that period extends from the close on 2024-09-04 through 2024-10-04.
The chart below displays the hypothetical cumulative $ +(-) achieved by holding a long position in platinum futures only during this period since 1987
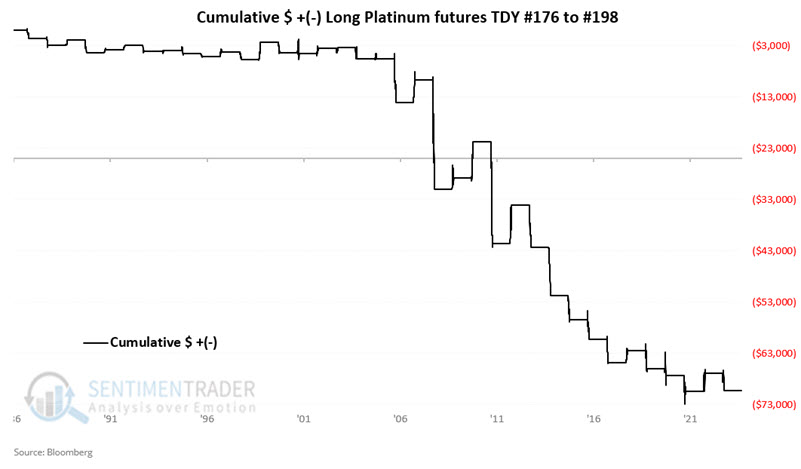
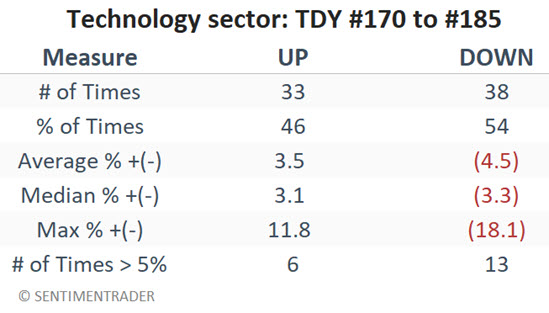
The table below summarizes platinum performance during this period.
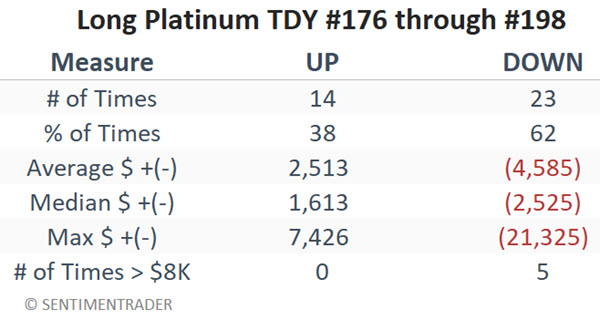
Here again, it is a mistake to assume that platinum futures are sure to keep falling in the month ahead. The metal has showed a gain during this period 38% of the time. Still, the direction of the equity curve above and the performance numbers in the table above (62% losers, average and median losses skewing heavily to the downside, and five losses of -$8K or more versus zero winners of +8K) would suggest to most traders to favor the short side.
What the research tells us…
Seasonality is best used not as a standalone tool to tell you precisely when to enter or exit a trade but as a guide to tell you "When to look where, and in which direction." Best results typically occur when seasonality is confirmed by actual price action trending in the expected direction. With platinum in an objective price downtrend and with XLK presently sitting just below its 50-day moving average, historical seasonality suggests that traders be looking for an opportunity to play the short side and that longer-term investors consider reducing positions or standing aside altogether during the period directly ahead.