
It's time to keep an eye on t-bonds

Key points
- Long-term treasury bonds have been savaged for most of the last five years
- Many pundits argue that t-bonds are "overdue" for a meaningful rally
- However, as long as price action and seasonality agree, investors are encouraged to remain cautious, and traders might continue looking to play the short side
The Great Bond Bear market
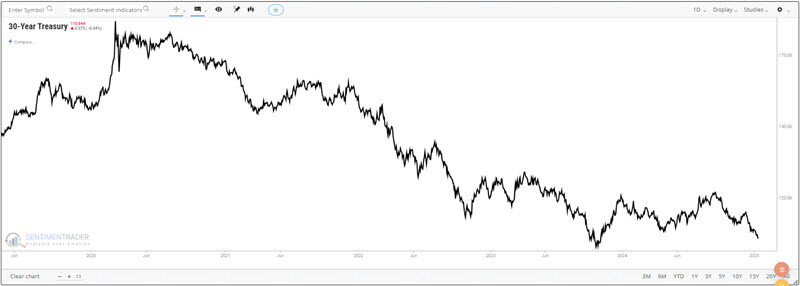
Long-term treasury bonds peaked during the Covid panic in March 2020, when long-term interest rates fell to about 0.84%. Since then, rates have risen to almost 5%, and bond prices have suffered dramatically. The chart below shows the damage done in the last nearly five years.
Meanwhile, many pundits take great comfort that the late 2023 low has yet to be taken out. There seems to be a consensus that if the Fed wishes to lower interest rates, then rates will fall-and bond prices will improve. And that outlook may prove to be accurate. However, it should be noted that while the Fed does have a great deal of ability to influence short-term interest rates, long-term rates are almost entirely determined by the market itself.
So, for now, as the adage states, "Trade the trend you see." Let's take that one step further: If price action and seasonality agree, go with the trend you see.
Bonds entering an unfavorable period
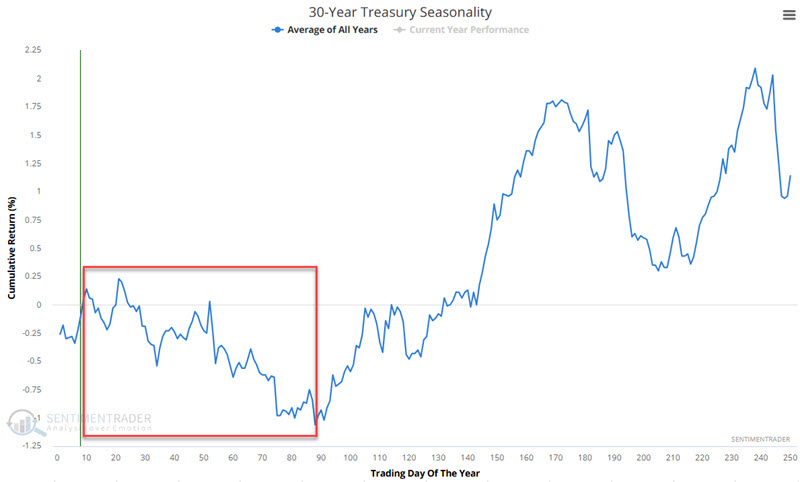
The chart below displays the annual seasonal trend for 30-year treasury bonds. The red box highlights a period that tends to be unfavorable for long-term treasury bonds. This period extends from the close on Trading Day of Year (TDY) #10 through TY #89. For 2025, this period extends from the close on 2025-01-15 through 2025-05-07.
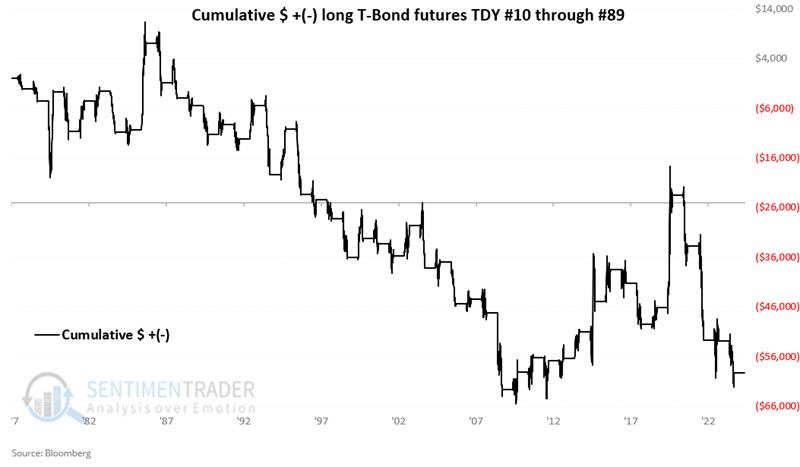
The chart below displays the hypothetical dollar gain/loss from holding a long position in t-bond futures only during this period every year since 1978.
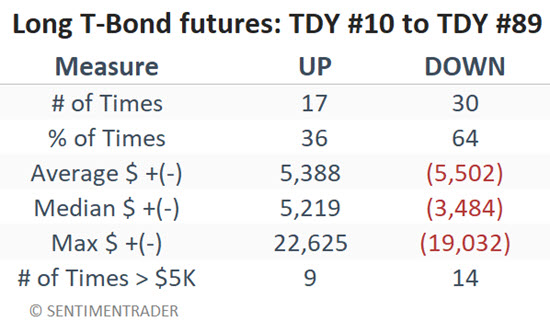
The table below summarizes t-bond futures performance during the TDY #10 through #89 period.
Factoring in price trend
Now let's add a 14-day exponential moving average for 30-year treasury futures and break results into two buckets:
- TDY #10 to #89 performance while price is above the 14-day EMA
- TDY #10 to #89 performance while price is below the 14-day EMA
In a nutshell, the second condition represents a situation where seasonality and price are both unfavorable. It also may involve some active in and out trading. If the price closes below the 14-day EMA during the TDY #10 to TDY #89 period, a trader will establish a short position in t-bonds futures. If the price closes above the 14-day period during this period, a trader will go flat.
Let's first examine the performance of t-bond futures during the TDY #10 to #89 period when the price is above the 14-day EMA. The chart below displays the hypothetical dollar gain/loss from holding a long position in t-bond futures when the price is above the 14-day EMA during the TDY #10 to #89 period.
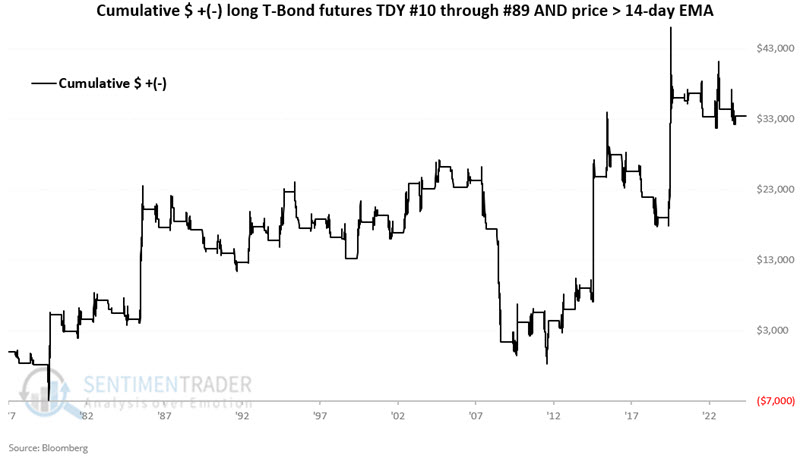
Overall, t-bonds carved out a definite - but highly erratic - gain. In this case, it has made sense not to push the short side when price and seasonality disagree.
Now, let's look at performance when seasonality and price agree. The chart below displays the hypothetical dollar gain/loss from holding a long position in t-bond futures when the price is below the 14-day EMA during the TDY #10 to #89 period.
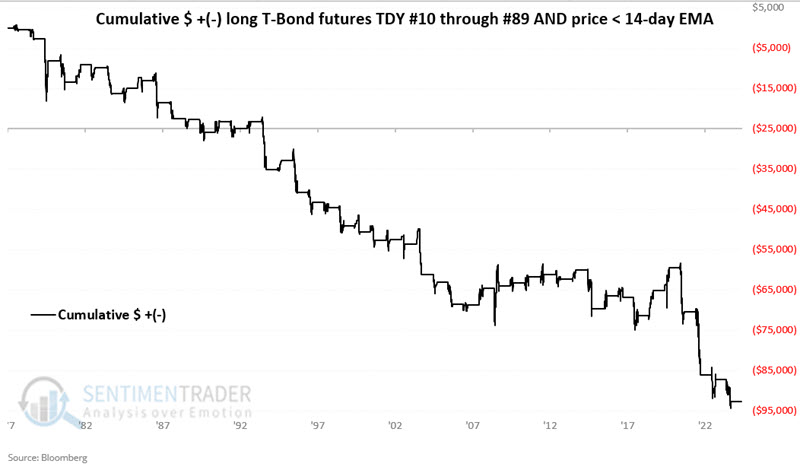
The chart above shows the danger of fighting the trend when both seasonality and price action are unfavorable and the potential for an aggressive trader to play the short side.
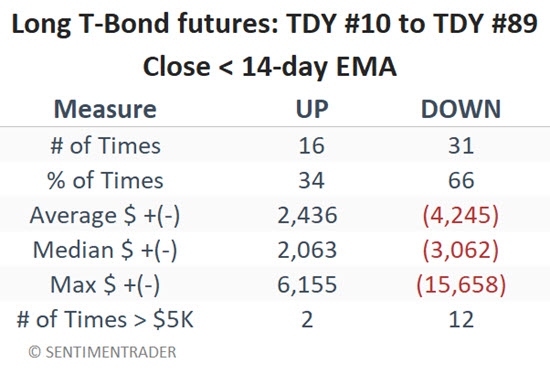
The table below summarizes the performance highlighted in the chart above.
Inverse ETFs for non-futures traders
Futures trading is not for everyone. Non-futures traders who wish to play the short side of the Treasury bond market may use inverse bond ETFs. Two possible choices are listed in the table below.
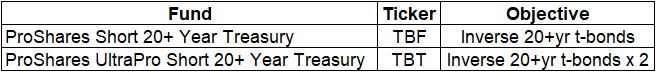
Inverse ETFs entail unique risks (particularly ticker TBT, which trades at 2x the underlying index). Investors should explore those risks independently and do their due diligence before investing. As always, capital allocation and stop-loss provisions remain the responsibility of each investor.
What the research tells us…
Many individuals seem to have adopted the same mentality for bonds they have for stocks - i.e., they "have to" rally sometimes. And in fact, a strong bounce is certainly possible. Nevertheless, the history of t-bond trading demonstrates a) a propensity for weakness in the early months of the year and b) that the odds greatly favor a continued decline when bonds are in a downtrend. As long as price action remains weak, investors may be wise to avoid long-term treasuries in the months ahead. Likewise, aggressive traders might continue to press the short side of the market until the trend suggests otherwise.