Products
SentimenTrader Trading Tools
‍
Backtest Engine
My Trading Toolkit
Correlation Analysis
Seasonality
Market Prediction
Indicators & Data API
‍
Proprietary Indicators & Charts
Market Data API
Strategies & Scanner
‍
50+ Trading Strategies
Smart Stock Scanner
Smart Option Scanner
Research Reports
‍
Research Solutions
Reports Library
Free Resources
Simple Backtest Calculator
Simple Seasonality Calculator
The Kelly Criterion Calculator
Sentiment Geo Map
Public Research Reports
Education
Sentiment Indicators
Technical Indicators
Pricing
Company
About
In the News
Testimonials
Client Success Stories
Contact
Log inLoginSign up
< BACK TO ALL REPORTS

It's time to keep an eye on soybeans - again

Jay Kaeppel
2023-04-05
Soybeans tend to rally during the late winter into early spring period. So far, this year has been a disappointment. But it might not be too late. The recent strong rebound combined with typical April behavior suggests soybean bulls may still have an opportunity.

Key points

  • Soybeans entered a seasonally favorable period on February 1st; so far, there has been only a sharp decline, followed by an equally strong rally
  • While some may conclude that things are just not working out this time around, starting now is often when the spring planting cycle-induced rally begins in earnest
  • ETF ticker SOYB offers an alternative to trading riskier soybeans futures

Soybeans are highly cyclical

In this article, dated 2023-01-30, I noted the historical tendency for soybean prices to rise between Trading Day of the #21 and TDY #90. That period started at the close on 2023-02-01. So far, beans have gone exactly nowhere. Well, not exactly. As you can see in the annual seasonal trend chart below, after TDY #21, beans rallied slightly,fell hard, and then rallied back to almost exactly where they started.

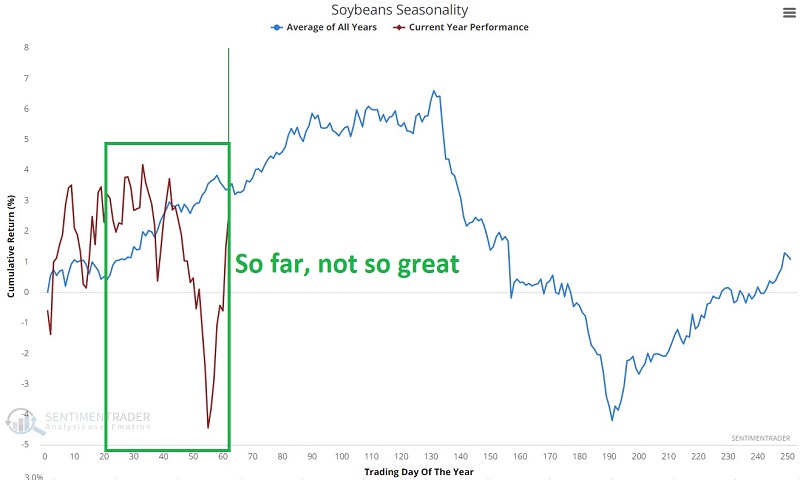
This type of volatility, whipsawing action can be enough to drive off even the most ardent bull. But another opportunity may be at hand. Note the area in the green box below. It highlights the period from TDY #64 through TDY #90.

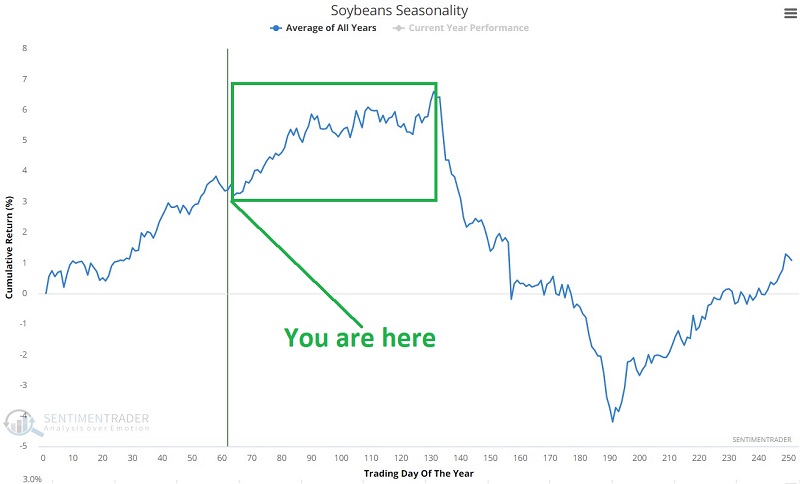
Let's take a closer look at this period.

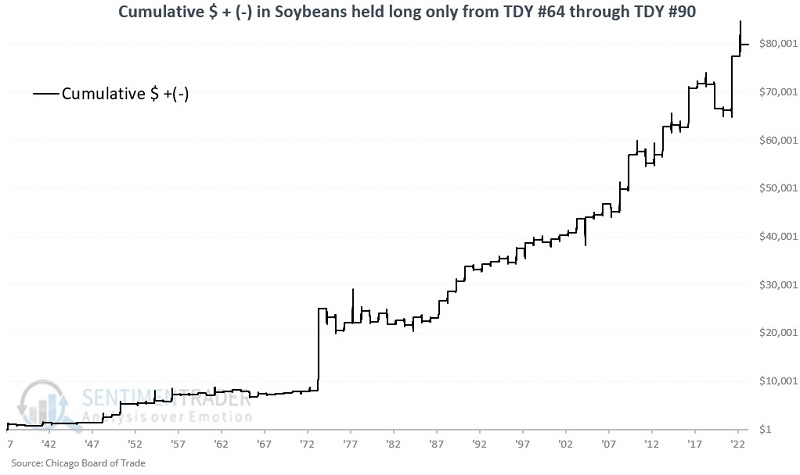
Each full-point movement in the price of soybeans represents a $50 change in the value of a soybean futures contract. The chart below displays the hypothetical $ gain from holding long one soybean futures contract only from the close on TDY #64 through TDY #90 each year starting in 1937.

The table below summarizes performance results.

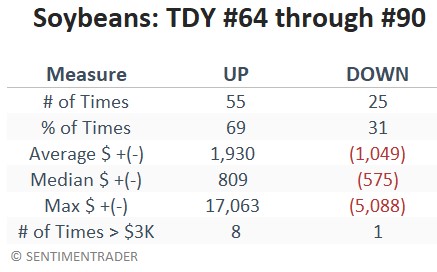
Note that traders who eschew futures contracts can play the long side of the soybean market via the Teucrium Soybean ETF (ticker SOYB), which is intended to track soybean futures, but which trades like shares of stock.

What the research tells us…

Soybeans are a highly cyclical market. Likewise, due to the planting schedule in the U.S., the spring period often sees bean prices rally as concerns about the upcoming harvest for the current year is in doubt. Soybean prices appeared to be breaking down in early March, raising fears that this might just be an off-year (and that remains a possibility). However, the recent rebound rally - combined with still favorable seasonality - raises the potential that beans will fulfill their common spring performance schedule and rally at least into early May.

PRODUCTS
SentimenTrader
Trading Tools
Indicators & Data API
‍
Strategies & Scanner
‍
Research Reports
FREE
RESOUrCES
Simple Backtest
Calculator
Simple Seasonality
Calculator
The Kelly Criterion
Calculator
Sentiment Geo Map
‍
Public Research Reports
‍
Education
Sentiment Indicators
‍
Technical Indicators
‍
Pricing
Bundle pricing
‍
FAQ
‍
Announcements
‍
COMPANY
‍
About
‍
In the News
‍
Testimonials
‍
Client Success Stories
CONTACT
‍
General Inquiries
‍
Media Inquiries
‍
Financial Professionals Inquiries
‍
© 2026 Sundial Capital Research Inc. All rights reserved.
Setsail Marketing
TermsPrivacyAffiliate Program
Risk Disclosure: The information and tools provided are for research and analytical purposes only and are not intended as investment advice. Market analysis involves uncertainty, and outcomes may differ from expectations. Users should conduct their own due diligence and consider their individual circumstances before making any financial decisions. Past performance is not necessarily indicative of future results.

Hypothetical Performance Disclosure: Hypothetical performance results have many inherent limitations, some of which are described below. No representation is being made that any account will or is likely to achieve profits or losses similar to those shown; in fact, there are frequently sharp differences between hypothetical performance results and the actual results subsequently achieved by any particular trading program. One of the limitations of hypothetical performance results is that they are generally prepared with the benefit of hindsight. In addition, hypothetical trading does not involve financial risk, and no hypothetical trading record can completely account for the impact of financial risk of actual trading. for example, the ability to withstand losses or to adhere to a particular trading program in spite of trading losses are material points which can also adversely affect actual trading results. There are numerous other factors related to the markets in general or to the implementation of any specific trading program which cannot be fully accounted for in the preparation of hypothetical performance results and all which can adversely affect trading results.

Testimonial Disclosure: Testimonials appearing on this website may not be representative of other clients or customers and is not a guarantee of future performance or success.