
Its time to keep an eye on soybeans

Key points
- Soybeans are entering a typically favorable seasonal period
- Price has fallen hard over the last six months, and sentiment is nearing a critical level
- Smart money (commercial hedgers) have been heavy buyers in recent months
- ETF ticker SOYB offers an alternative to trading soybean futures
Soybeans have been beaten down
Soybean futures hit a high of 1547 in July 2023 and have stair-stepped lower ever since.
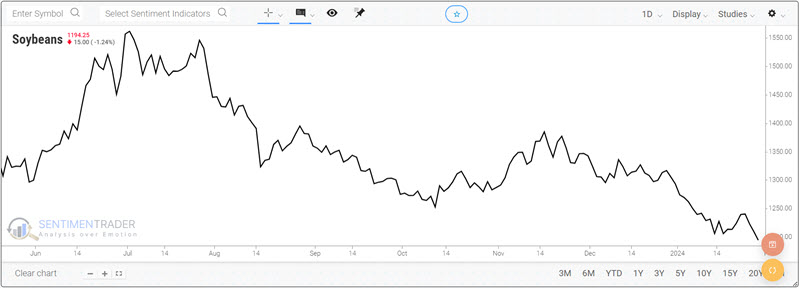
Analyzed on a trend-following basis, it is correct to designate soybeans as mired in a downtrend. But as we can see in the longer-term chart below, soybeans are the type of market that tends to "turn on a dime" (in both directions).
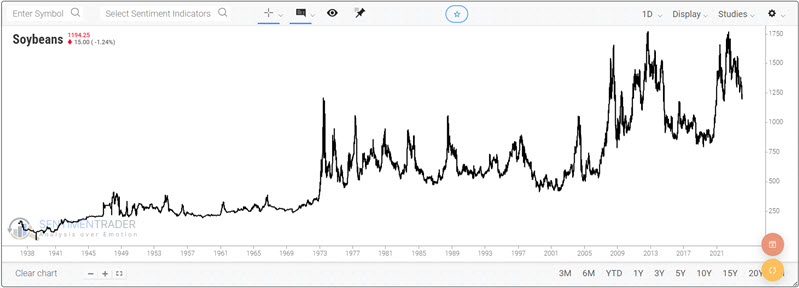
Are beans going to turn on a dime soon and reverse higher anytime soon? We cannot predict. However, there is ample reason to be looking for - and preparing to act upon - this type of action.
Soybeans entering the most favorable seasonal period
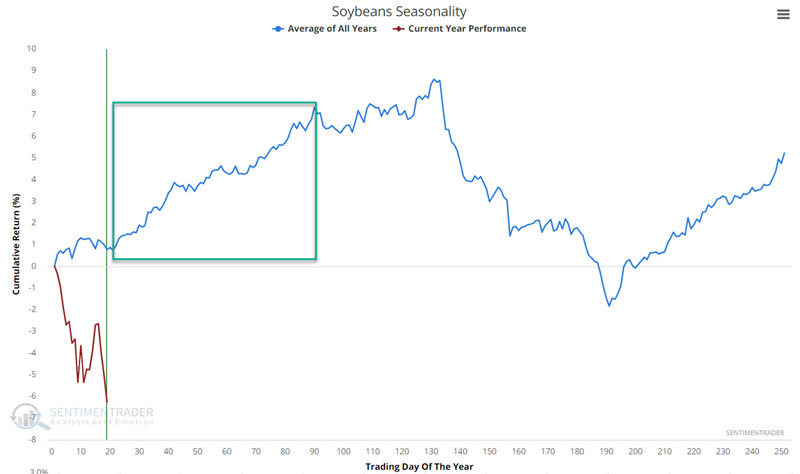
Doubts about the soybean crop for the current year tend to be highest a) when there are no seeds in the ground in the U.S. Midwest (winter into early spring) and b) during planting season when weather can help or hurt the crop (spring). As you can see in the annual seasonal trend chart below, this tends to manifest in rising soybean prices. The chart below highlights the seasonal tendency from Trading Day of the Year #21 through TDY #90 in the green box.
For 2024, this period extends from the close of 2024-01-31 through the close of 2024-05-09.
The chart below displays the hypothetical cumulative $ +(-) achieved by holding a long position in soybean futures from the end of Trading Day of Year (TDY) #21 through TDY #90 every year starting in 1937.
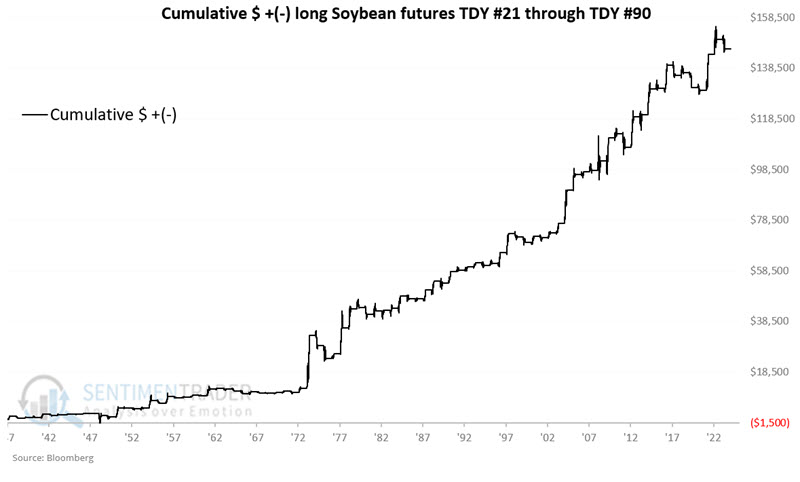
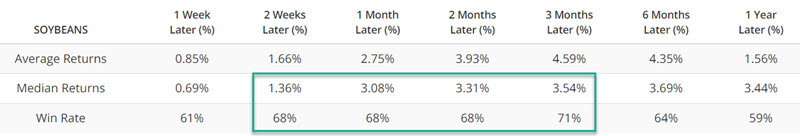
The long-term tendency to advance is evident. However, performance can vary significantly from year to year. The table below summarizes soybean performance during this seasonal period.
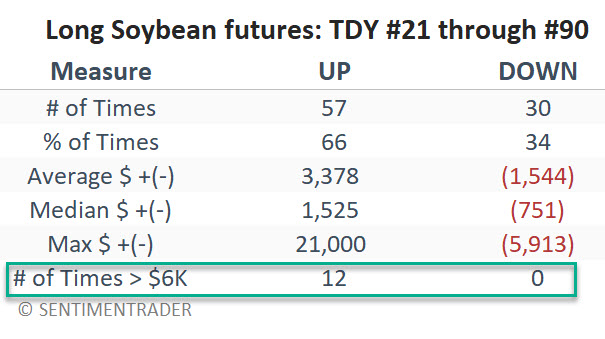
The good news is that overall, positive years significantly outperform negative years on average. The median up year showed a gain of +$1,525 versus a median down year loss of -$751. Even more telling is that years that showed a net gain or loss of $6K or more all skewed to the positive side.
Sentiment is "getting there"
Not surprisingly, as soybean prices have fallen, trader sentiment has declined. The chart and table below highlight those dates when the 20-day average of our Soybean Optix value has crossed below 22.6%. When this threshold was crossed, beans moved higher 94% of the time over the ensuing three months.
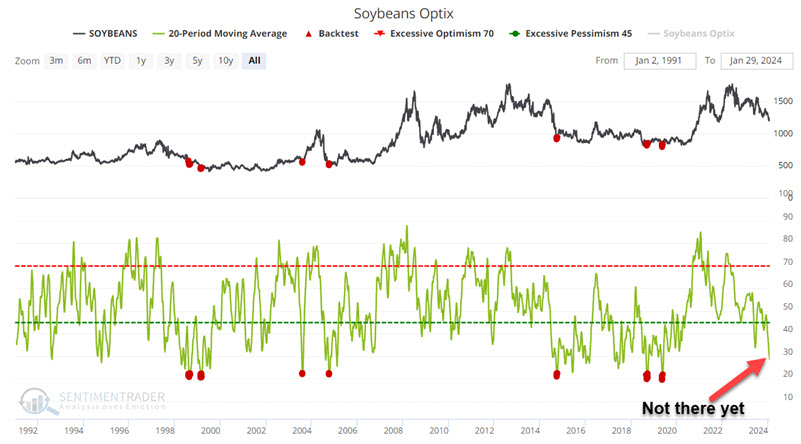
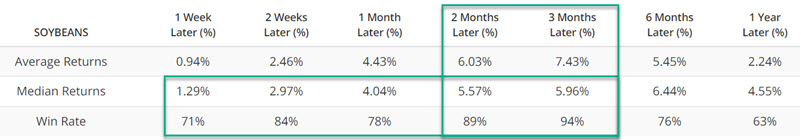
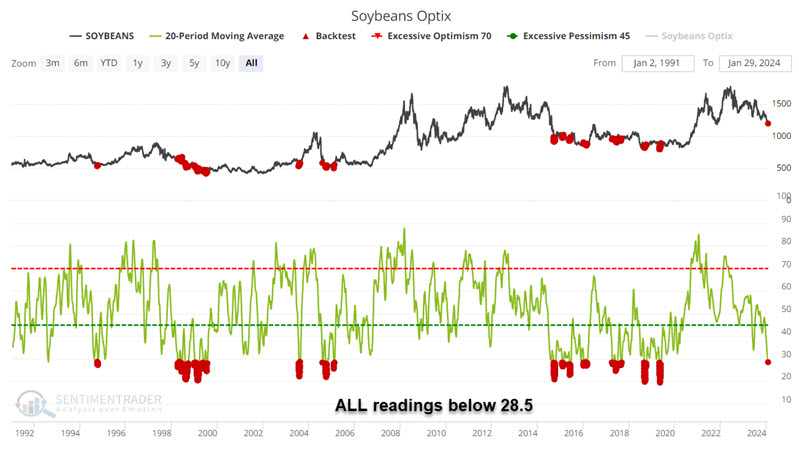
However, as you can see in the chart above, we have not reached this level yet. So, let's consider "where we are now." The chart and table below highlight those dates when the 20-day average of our Soybean Optix value has crossed below 28.5%.
The bad news is that results are less one-sidedly favorable than those above. Still, the good news is that three-month results skew meaningfully to the positive side. As a result, I consider the latest Soybeans Optix reading as falling on the favorable side of the weight of the evidence ledger.
Hedging action sends a potential signal
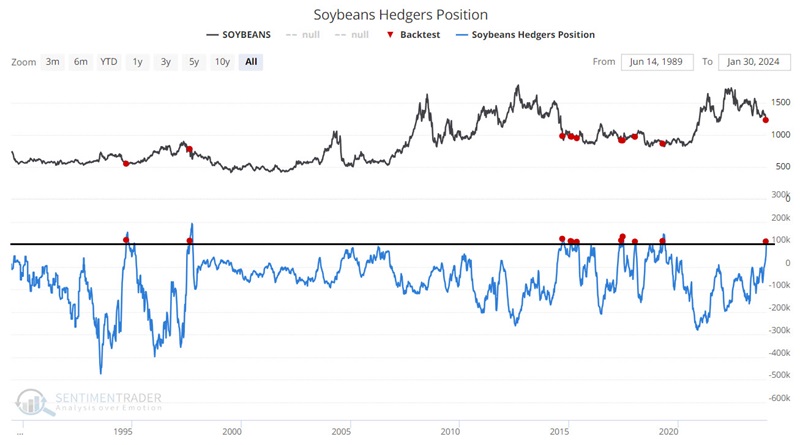
Commercial Hedgers are commonly considered the "smart money," as these traders are involved in the day-to-day operations of each commodity. They have an excellent handle on the underlying market, and it typically pays to follow their positions when they reach an extreme.
As you can see in the chart below, hedger positions recently crossed above the +110K level, a relatively rare occurrence.
The table below summarizes soybean futures performance following those dates highlighted above.
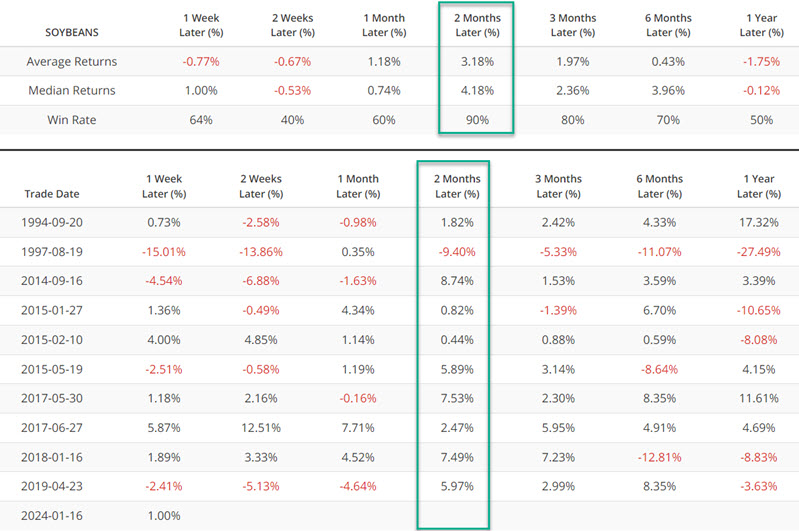
The key figure in the table above is the 2-month 90% Win Rate. As always, this does not guarantee a rally this time around. But it does dovetail nicely with the other items highlighted above on the favorable side of the ledger.
From current price levels, a median two-month move of +4.18% would translate to a roughly 50-point move in soybean futures or a contract dollar value of approximately $2,500 (each point represents a $50 change in contract value).
Using an ETF as an alternative
The Teucrium Soybean Fund (SOYB) is an exchange-traded security designed to track the movements of soybean futures prices in percentage terms. SOYB issues shares that may be bought and sold like shares of stock.
The futures contracts held by ticker SOYB are based on their own proscribed roll schedule. This means that the daily percentage fluctuation in SOYB may differ from those of the spot contract we used above to track soybean futures directly.
The chart below displays the growth of $1 invested in SOYB only during TDY #21 through TDY #90 for soybean futures since SOYB started trading in 2011.
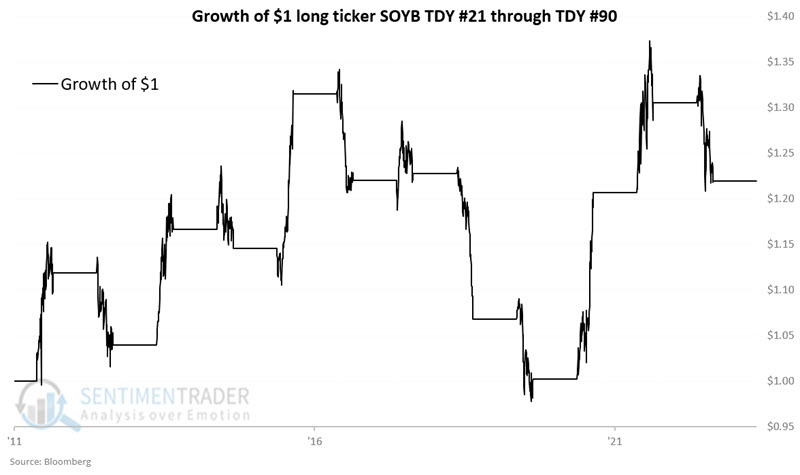
The table below summarizes SOYB performance during the early year favorable seasonal period since its inception in 2011.
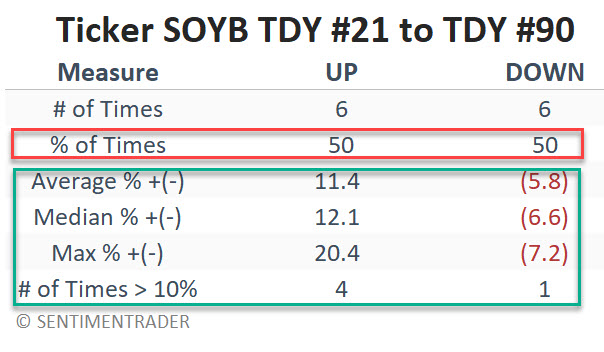
The good news is that up years have skewed more positively than down years have negatively (median up year of +12.1% vs. median down year of -6.6% and four years of +10% or more versus only one year of -10% or more). However, the 50% Win Rate suggests that year-to-year performance has been a coin flip.
Still, for a trader who finds the case for soybeans compelling but does not want to trade in the futures market, buying shares of SOYB remains a viable option.
What the research tells us…
Seasonality, sentiment, and smart money all appear to be aligning on the favorable side of the weight of the evidence ledger for soybeans. So what could go wrong? Anything. No confluence of indicators ever guarantees a given outcome in the financial markets. Nevertheless, trading is a game of odds. Given the current configuration, now is the time for traders to look for a change of fortune in the soybean market.