
Its time to keep an eye on silver (and to be patient) - Part I

Key Points
- Silver has essentially been locked in a large trading range for roughly the last decade
- After a nice run off an October low, silver once again suffered a sharp downside reversal in the last week
- Several long-term cycles suggest that traders keep an eye on silver in hopes of a meaningful run to the upside in the years ahead
Combining three seasonal periods
Silver has been trading in a giant trading range for most of the last decade. A million and one "predictions" regarding "where silver is headed next" have died in that range.
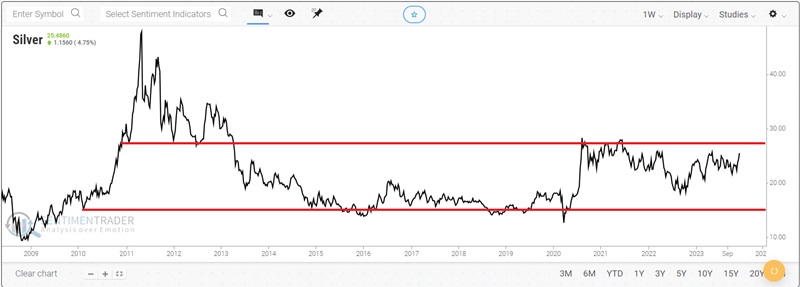
Let's not make any predictions about if and when silver might break out of the range in the chart above. But for now, let's also not throw in the towel on the hope that silver could stage a breakout to the upside in the years directly ahead. The message here is not "buy silver," but more one of "be patient and keep an open mind to the possibility of buying silver despite its seemingly endless propensity to disappoint."
The model detailed in Part II is not presented as an "automatic" trading system (although theoretically, it could be used as such). The goal is to use the model to alert of potentially favorable and unfavorable periods to hold either a long or short position in silver.
The model combines three distinct - but often overlapping - seasonal windows:
- Six favorable months of the year for silver
- The 8-year cycle for silver
- The 30-year cycle for commodities
Let's examine these periods one at a time, and then in Part II, we will put them together into one model.
We will look at price data for silver futures starting in 1950 for testing purposes. Each full point of price movement (1.00) for silver is worth $5,000 in futures contract value. Note that before the 1970s, the price of silver was heavily manipulated by the government (which was still using silver to make coins and thus wanted to keep costs low).
Six favorable months of the year for silver
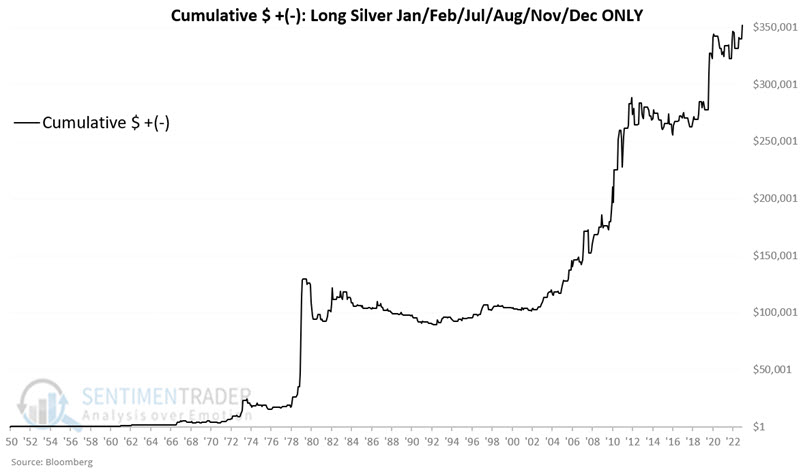
The following six months of the year are deemed "favorable":
- January, February, July, August, November and December
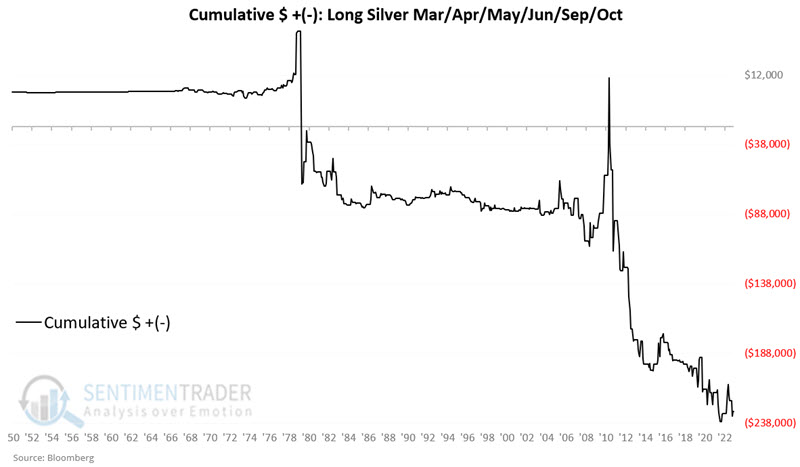
The following six months of the year are deemed "unfavorable":
- March, April, May, June, September and October
The chart below displays the hypothetical cumulative $+(-) from holding a long position in silver only during the favorable months listed above. The cumulative hypothetical gain is $352,052.
The chart below displays the hypothetical cumulative $+(-) from holding a long position in silver only during the favorable months listed above. The cumulative hypothetical loss is -$229,692.
The eight-year cycle for silver
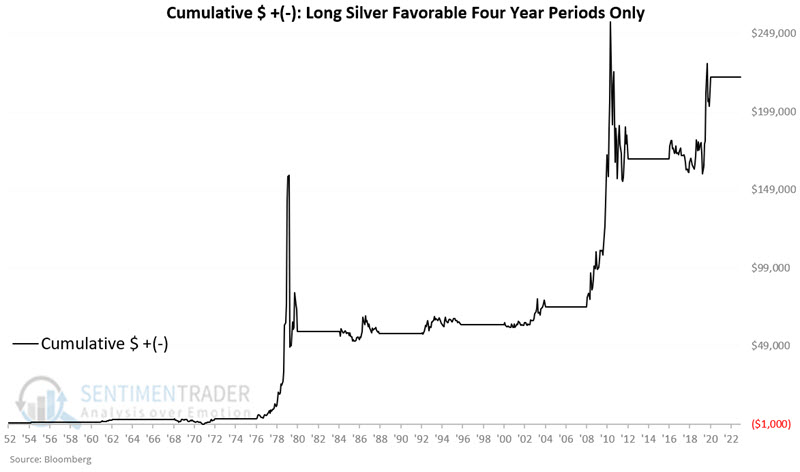
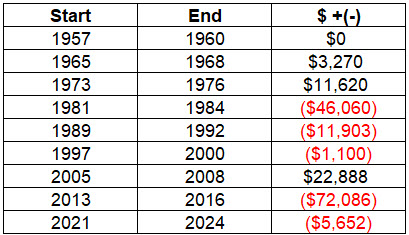
We will start the eight-year cycle after the close on 1952-12-31. The first four years of each cycle are considered "favorable" for silver, and the second four years are considered "unfavorable." Let's look first at the favorable four-year periods. The table below reflects the dollar value change from holding a hypothetical long position in silver futures (each $1 movement in the price of silver equals $5,000 in contract value).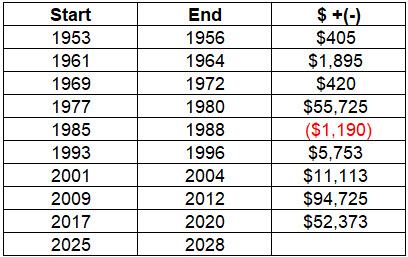
The chart below displays the hypothetical cumulative $+(-) from holding a long position in silver only during the favorable four-year periods listed above. As you can see, while net results are highly favorable, massive drawdowns along the way remind us of the limitations of using this approach on a mechanical basis. Cyclical trends are best used as "weight of the evidence."
Now, let's look at the unfavorable four-year periods. The table below reflects the dollar value change from holding a hypothetical long position in silver futures (each $1 movement in the price of silver equals $5,000 in contract value).
The chart below displays the hypothetical cumulative $+(-) from holding a long position in silver only during the unfavorable four-year periods listed above. Since the 1970s, these periods have been highly unprofitable - but, once again, with massive countertrend movements along the way.
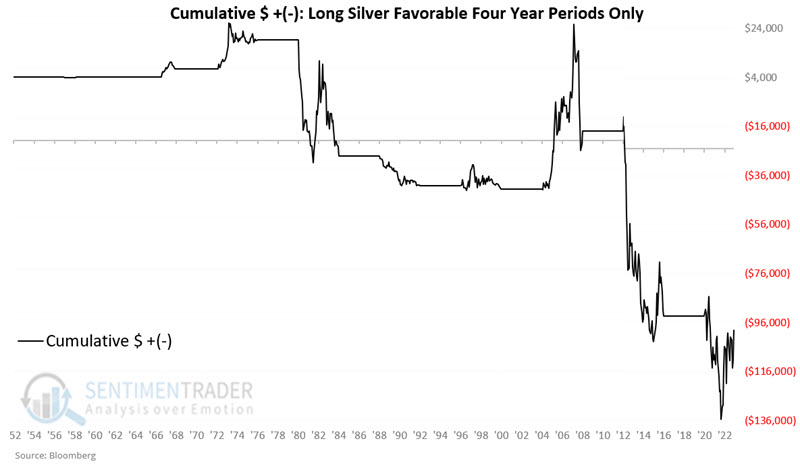
A four-calendar year cycle is not a "precision timing tool." That said, this cycle has done an excellent job of pointing silver traders in the proper direction. The current cycle will end on 2024-12-31, at which point a new favorable four-year period will begin and last through the end of 2028.
The 30-year cycle for commodities
In a series earlier this year, I highlighted the 30-year cycle for commodities as an asset class (see here, here, and here).
The following 15-year periods are deemed "favorable" for commodities:
- 1933-06-30 to 1948-06-30
- 1963-06-30 to 1978-06-30
- 1993-06-30 to 2008-06-30
- 2023-06-30 to 2038-06-30
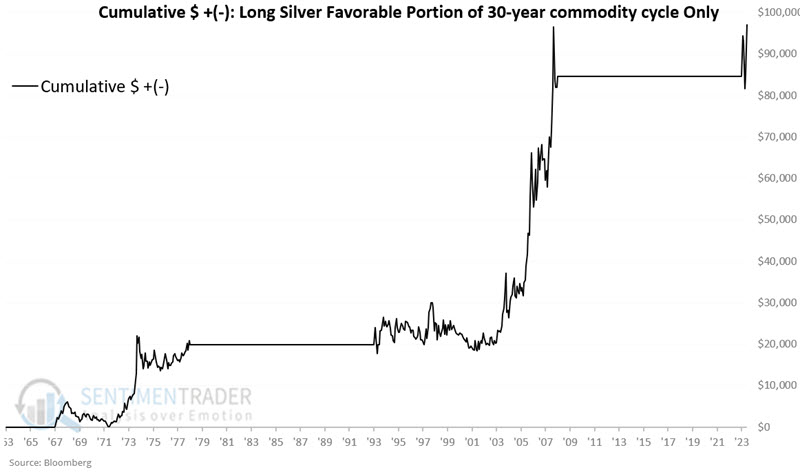
The chart below displays the hypothetical cumulative $+(-) from holding a long position in silver only during the favorable 15-year periods listed above, starting in 1953.
The chart below displays the hypothetical cumulative $+(-) from holding a long position in silver only during the unfavorable 15-year periods listed above, starting in 1953. 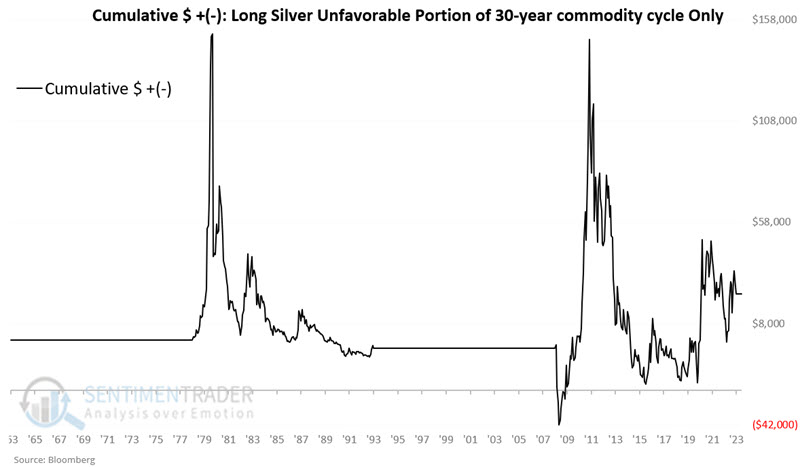
Silver has registered a net gain during these "unfavorable for commodities as an asset class" periods. However, as you can see in the chart above, buying and holding silver during these times would have been a roller-coaster that few could - or would even want to - ride.
What the research tells us…
Silver has shown itself to be a highly cyclical market. The good news is that as "weight of the evidence," the cycles highlighted above can help to guide a trader in the proper direction. Unfortunately, none of the cycles above lend themselves to being useful standalone "trading systems" - due to the large fluctuations in value along the way, the occasional massive countertrend move, and the propensity to chop and go sideways for literally years at a time.
The good news is that when we combine these three cycles, we may get a clearer picture regarding which direction we should trade silver at any given time. Stay tuned for Part II.