
It's time to keep an eye on silver

Key points:
- Several indicators that have presaged significant gains for silver in the past have recently flashed new signals
- In the meantime, seasonality and an important trend-following filter are still negative factors
- Traders should be watching the trend very closely for signs of a reversal
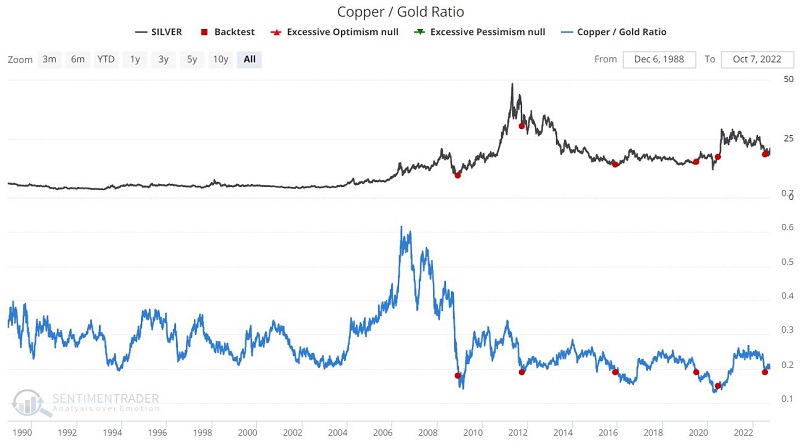
The copper/gold ratio flashes a rare bullish signal
Volatility across markets has been ratcheting higher. That's the case even within some markets, like precious metals.
Recently, the price of copper plunged relative to gold. Despite not being part of the calculation, extremes in this ratio have been consistent signals for silver. The chart below displays those dates when the Copper/Gold Ratio crossed below 0.19 for the first time in a year.
The tables below display results for silver futures and the iShares Silver Trust ETF (ticker SLV).
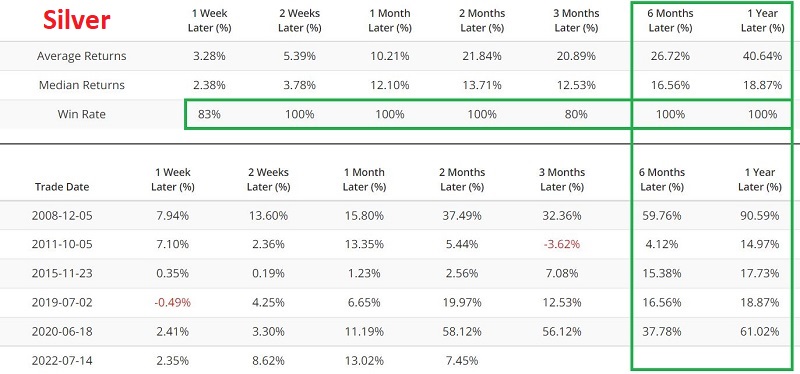
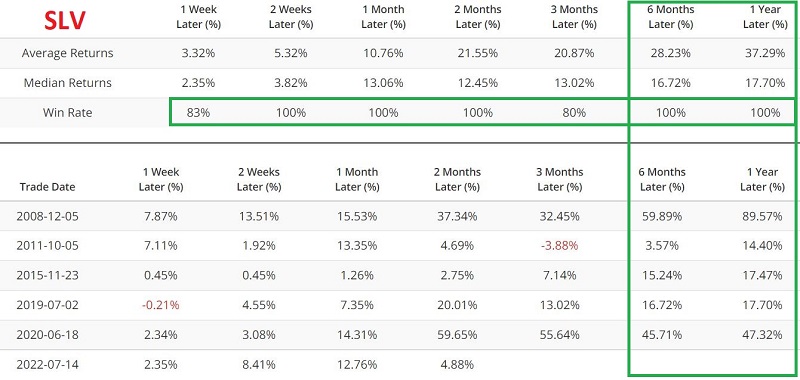
Previous signals have seen silver turn up immediately and, in some cases, rocket higher. The caveat here is the small sample size. Still, aggressive traders may note that silver is trading above its level on the latest signal in July and that a natural stop-loss level below the mid-August low is in place.
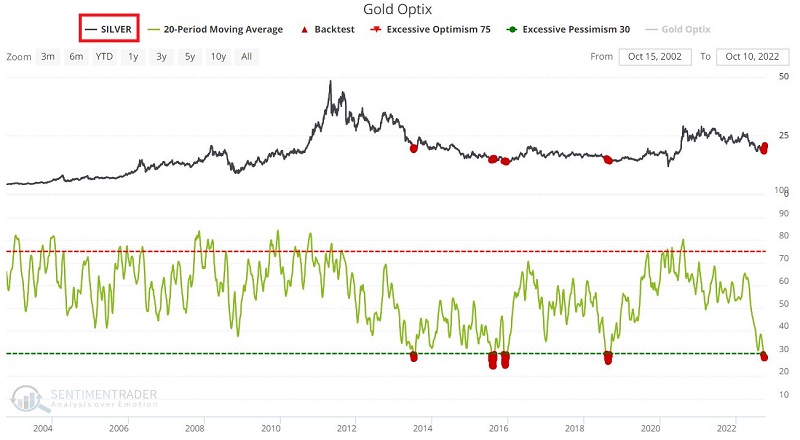
Precious metals bearish sentiment recently reached an extreme
Gold is the most prominent precious metal. We will use our Gold Optimism Index (Optix) to measure trader sentiment towards the precious metals group. The chart below shows those dates when the 20-day average for Gold Optix dropped below 30%.
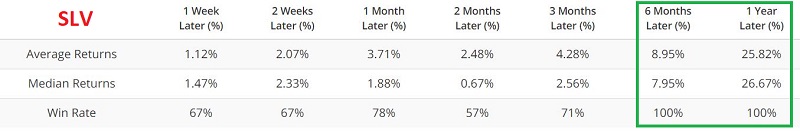
The tables below display results for silver futures and the iShares Silver Trust ETF (ticker SLV).
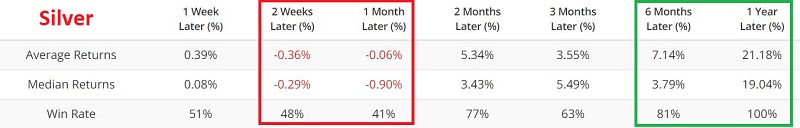
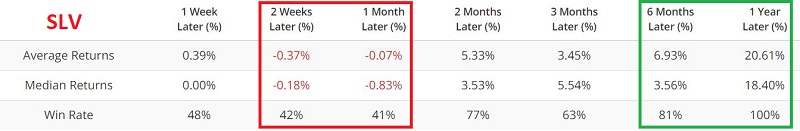
This signal has been active every day since September 22. Historically, the performance of silver during the first month after a signal has been relatively weak but powerful in the ensuing eleven months. This suggests a potential buying opportunity later this month.
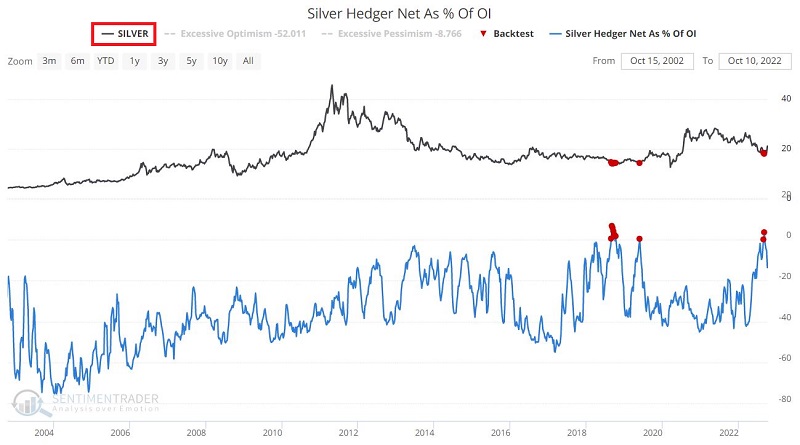
Silver hedging reaches a rare extreme
For one of the few times in history, smart money commercial hedgers recently went net long silver futures. The chart below displays those dates when the Silver Hedger Net As % of Open Interest rose above 0.
The tables below display results for silver futures and the iShares Silver Trust ETF (ticker SLV).
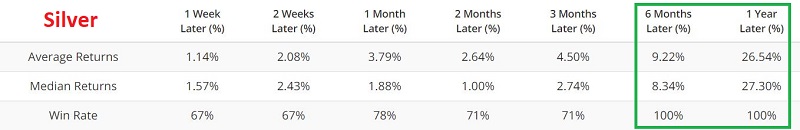
The catch with each of the indicators we have seen so far is that the sample sizes are tiny, so there is a danger in assigning them too much weight. Nevertheless, the sample size is small because we are looking at extreme readings, which will not occur often.
The bottom line: If we trust what these indicators are saying, there is the potential for an explosive rally in silver in the months ahead.
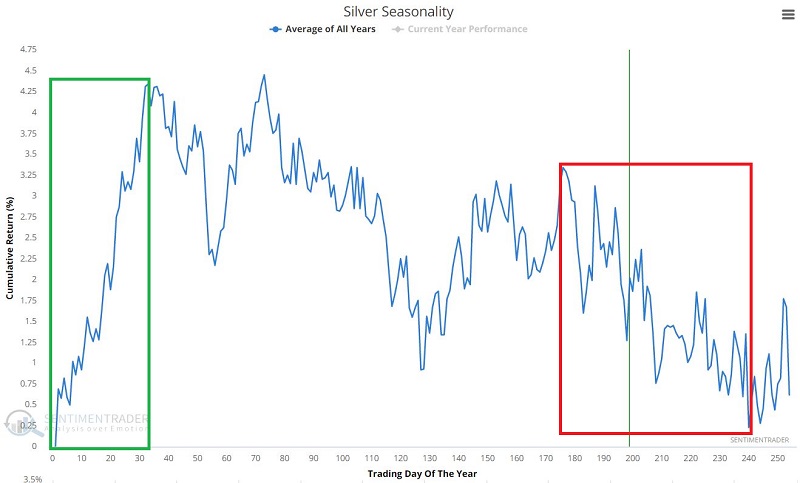
Seasonality is still a headwind
The chart below displays the annual seasonal trend for silver futures. Note that we are still in an unfavorable period. That does not mean that silver cannot rally soon. It simply means that the odds do not favor an advance in the near term. Note that the seasonal environment turns much more favorable after the 1st of next year.
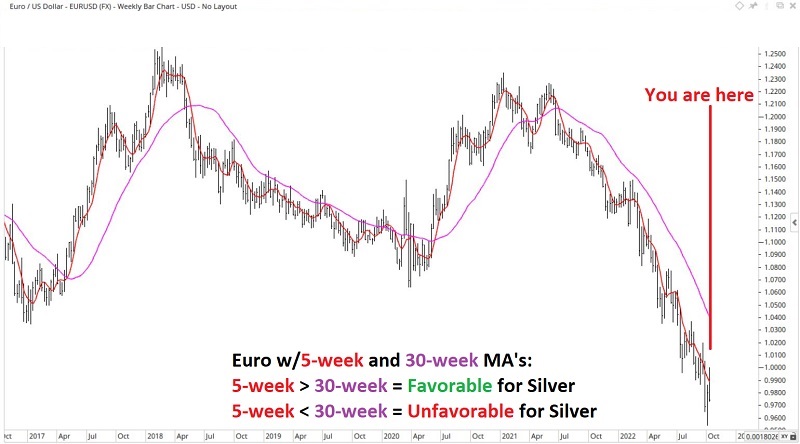
A trend-following filter
Silver trades with a reasonably high correlation to the euro.
The chart below displays the euro with a five-week and thirty-week moving average. Historically, it is considered favorable for silver if the 5-week moving average for the euro is above the 30-week moving average and vice versa. The euro is presently in a strong downtrend at the moment. Like seasonality, this does not preclude the possibility of an advance by silver, but it is a negative factor.
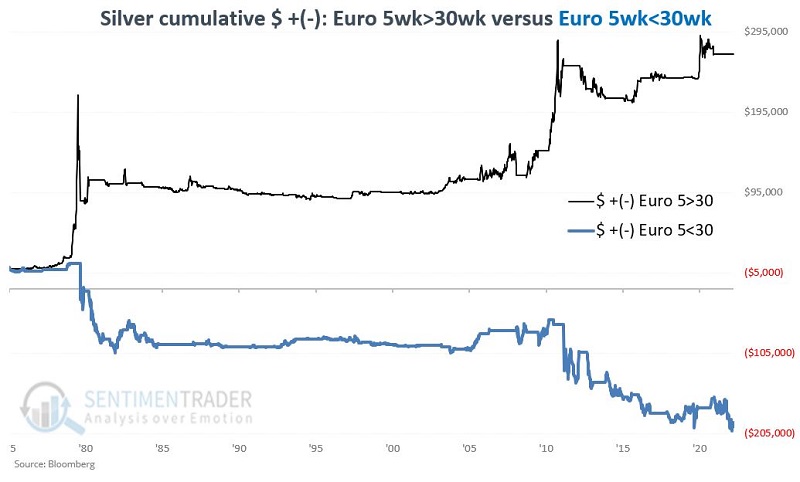
The chart below shows the cumulative dollar return in silver futures depending on whether the euro 5-week average is above or below the 30-week average. The data series for the euro comes from Bloomberg, and euro data before 1999 are estimated values.
Silver performance has been far better when the euro is in an uptrend.
What the research tells us…
The first three indicators above suggest that a significant rally could be in the cards and that traders should look for a buying opportunity in silver. On the other hand, seasonality and trend-following argue that the time may not be precisely ripe for a dive into the long side of silver. The probability of a meaningful advance will improve when the euro someday resumes an uptrend and/or after the first of 2023 when the seasonal pattern turns favorable.