
Its time to keep an eye on natural gas (and UNG and KOLD)

Key Points
- Natural gas enjoyed a 75% spike between October and December 2024
- Especially cold weather has many pundits predicting still higher prices
- Meanwhile, seasonality and sentiment stand as a warning sign in the month ahead
Natural gas surprised, but history suggests caution in the short-term
Natural gas futures rallied sharply in the fourth quarter of 2024. This volatile commodity shot roughly 75% higher in a matter of months.
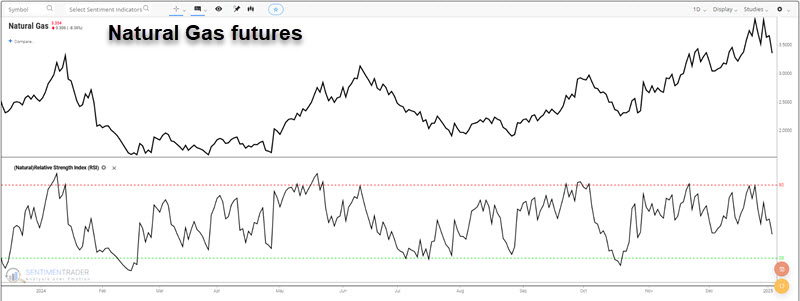
Since peaking in late December 2024, natty has sold off sharply and then bounced again. Given the forecast for well below-average temperatures in many parts of the U.S., many are forecasting another sharp advance. And they may very well be right. However, there is a reason to avoid betting too heavily on the bullish side.
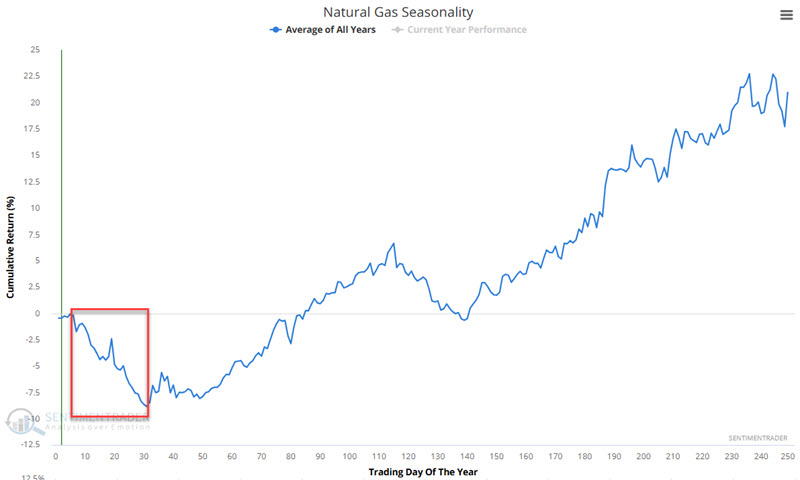
Seasonality strongly urges caution
The chart below zooms in on the annual seasonal trend for natural gas. Historically, the period from Trading Day of the Year (TDY) #5 through TDY #31 has witnessed weakness. For 2025, this period extends from the close on 2025-01-08 through 2025-02-13.
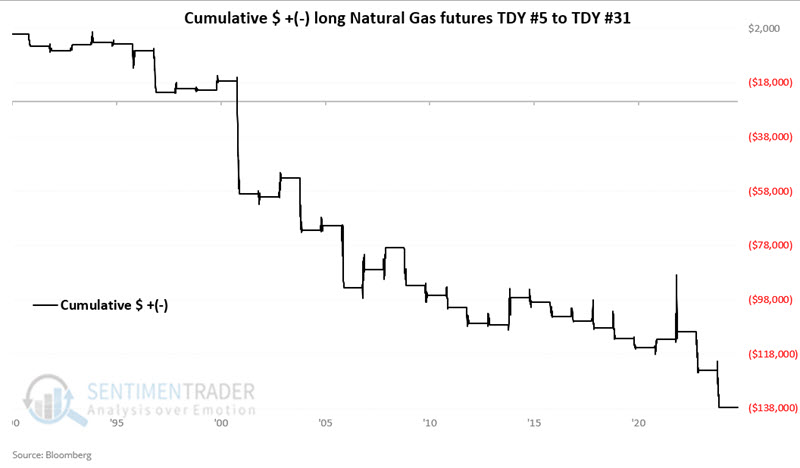
The chart below displays the hypothetical cumulative $ +(-) achieved by holding a long position in natural gas futures only from the close of TDY #5 through TDY #31 every year since 1991.
The table below summarizes natural gas performance during this relatively short window.
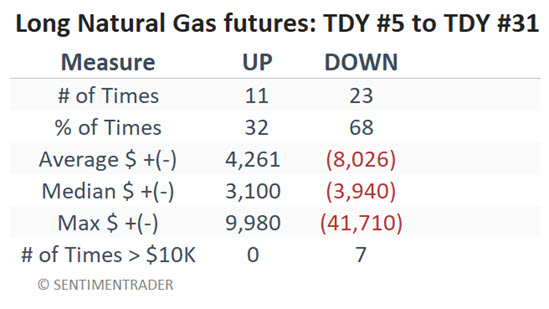
While the chart above suggests a relentless decline, the table shows that natural gas has gained during this period in one out of three years. So, as always, there are no sure things.
It is important to emphasize that no trader should blithely enter a short position in the natural gas futures market and forget about it. On four separate occasions, natural gas futures have gained $6,000 or more - including a maximum gain of $9,980 (in 2014). Risk management is mandatory when trading natural gas futures.
A look at natural gas ETFs
The United States Natural Gas Fund LP ETF (ticker UNG) is intended to track the price action in natural gas futures. The chart below displays the hypothetical growth of $1 holding ticker UNG only during the TDY #5 to #31 period.
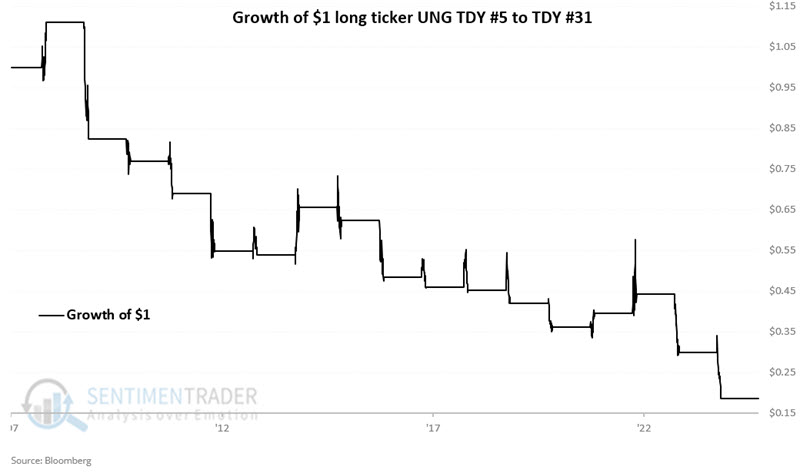
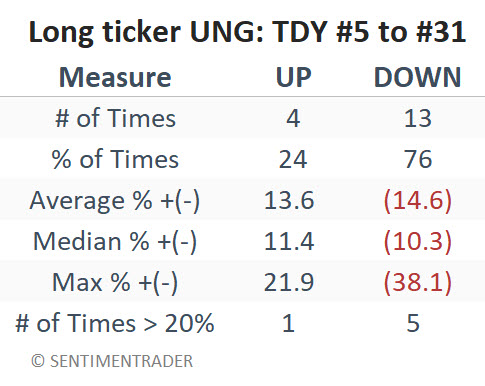
The table below summarizes UNG results.
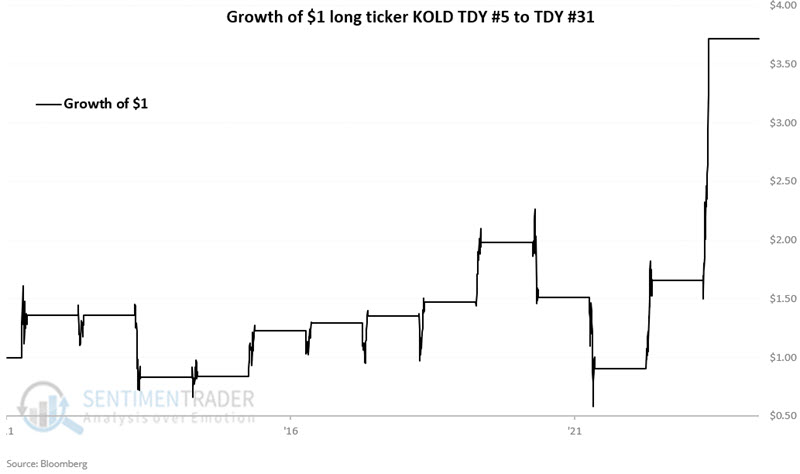
For those looking to play the short side of natural gas during this period, the ProShares UltraShort Bloomberg Natural Gas ETF is another possibility. This fund seeks daily investment results that correspond, before fees and expenses, to -2x the daily performance of its underlying benchmark. So, in theory, this ETF should rise in price if natural gas declines.
Any investment in this ETF must be considered an extremely high-risk/high-reward endeavor. The chart below displays the hypothetical growth of $1 holding ticker KOLD only during the TDY #5 to #31 period since 213.
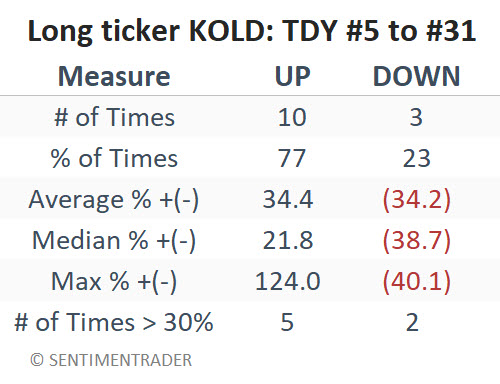
The table below summarizes KOLD results.
The comparative year-by-year results appear in the table below.
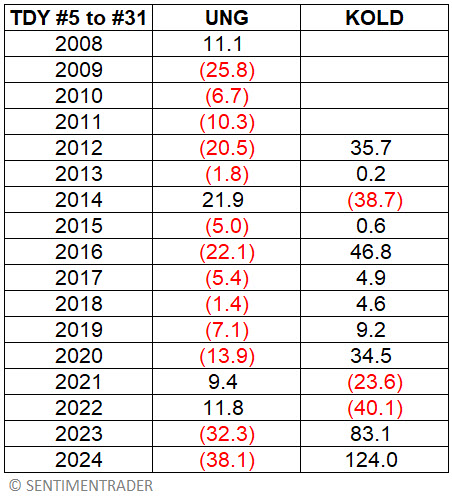
It is very easy for the KOLD returns for 2023 and 2024 (+83.1% and +124.0%, respectively) to fill one's eyes with stars. However, it is essential to note that the losses accumulated during the three losing years for KOLD (2014, 2021, and 2022) were huge (-38.7%, -23.6%, and -40.1%, respectively). The median percentage price move for ticker KOLD for the TDY #5 to TDY #31 period is 34%. This illustrates the importance of aligning seasonality and price (or inverse alignment in this case, since KOLD is an inverse fund) to maintain a position.
Sentiment also signals a warning
The recent favorable trend for natural gas combined with recent forecasts of seriously below-average temperatures across much of the U.S. is fueling bullishness among traders. However, aggressive traders should remain alert to the potential to play the short side in the months directly ahead (if the trend - however a given trader might define it - shows signs of reversing).
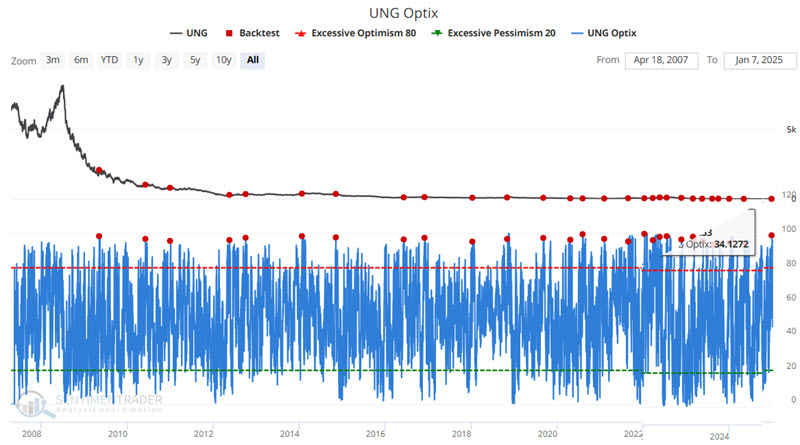
The chart below highlights those dates when our UNG Optix indicator crossed above 94.9% for the first time in two months. The most recent crosses above 94.9% occurred on 2024-12-30 (and again on 2025-01-06; however, that signal is not reflected in this test since it is not two months or more after the 2024-12-30 signal).
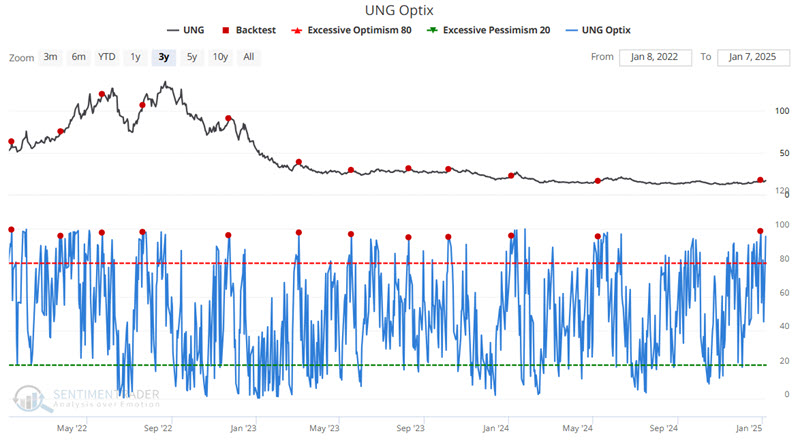
The chart below zooms in on the last three years.
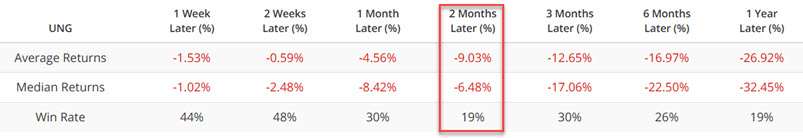
The table below summarizes UNG's performance following previous signals. Note the 2-month Win Rate % of just 19%.
The table below displays signal-by-signal results for UNG.
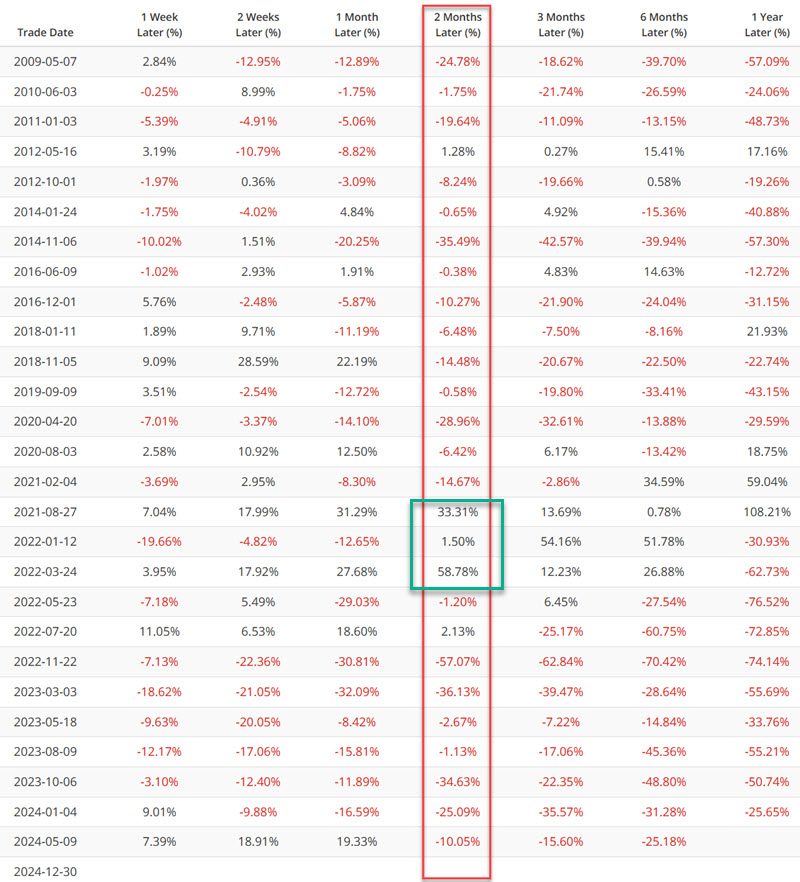
The good news is the high probability of a decline during the two months after a signal. The bad news is highlighted in the green box in the table above, i.e., natural gas can experience explosive moves. Stubbornly holding a short position in natural gas futures or UNG shares (or a long position in KOLD) is an invitation to disaster. A reasonable stop-loss is mandatory. A bearish position using options on ticker natural gas futures or UNG may offer a limited risk opportunity for those looking to play the short side of this highly volatile market.
What the research tells us...
History suggests that speculative traders looking to put the odds in their favor look for opportunities to play the short side of natural gas between now and mid-February 2024. Note that trading natural gas futures entails significant leverage and risk. Non-futures traders might consider a bearish option position using options on the United States Natural Gas Fund ETF (ticker UNG) or a long position in ticker KOLD. Remember, though, natural gas trading is not for the faint of heart.