
Its time to keep an eye on natural gas (and UNG)

Key points
- Natural gas bottomed in February 2024 and has been trending higher
- Price action is favorable above a newly rising 200-day moving average
- Nevertheless, traders should be careful about falling in love with the long side of natural gas, and history suggests watching closely for an opportunity to play the short side in the month ahead
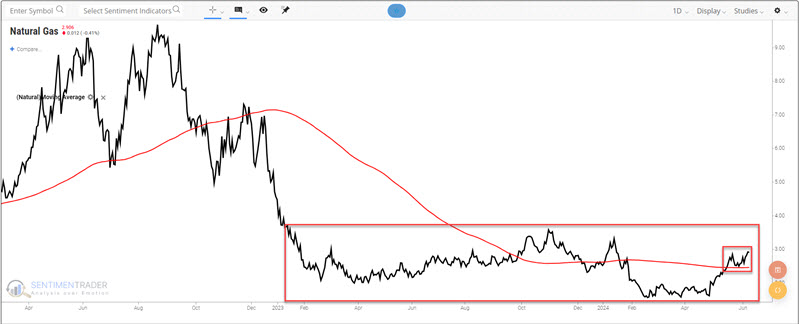
Natty is working higher within a long sideways channel
We rarely rely on our "chart reading" ability to identify trading opportunities. For one thing, chart patterns can be highly subjective (for another thing, I'm not very good at it). Still, one could argue that the price action in the chart below is "constructive" for natural gas futures. After bottoming in early 2023, natty has traded sideways in a wide channel, arguably forming what some might consider a "solid long-term base" (which, according to chart theory, could serve as a launching pad for a long-term advance). In addition, the price has recently moved back above its 200-day moving average, and that moving average has started to trend higher.
Does this mean it's time to pile into the long side of natural gas? Not necessarily. This is especially true given that this market is about to enter a short - but often nasty - seasonal period.
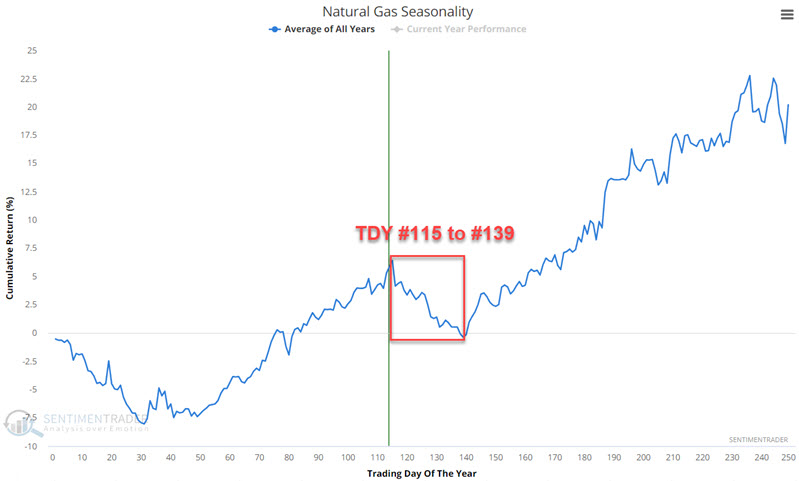
Entering an unfavorable seasonal window
As I have repeated ad nauseum, an annual seasonal chart is simply an average of what has happened in the past and is NOT a roadmap to what will happen this time. That said, note in the annual seasonal chart below that natural gas futures are entering a period of seasonal weakness that extends from the close of the trading day of the year (TDY) #115 through TDY #139. For 2024, this period extends from the close on 2024-06-11 through 2024-07-16.
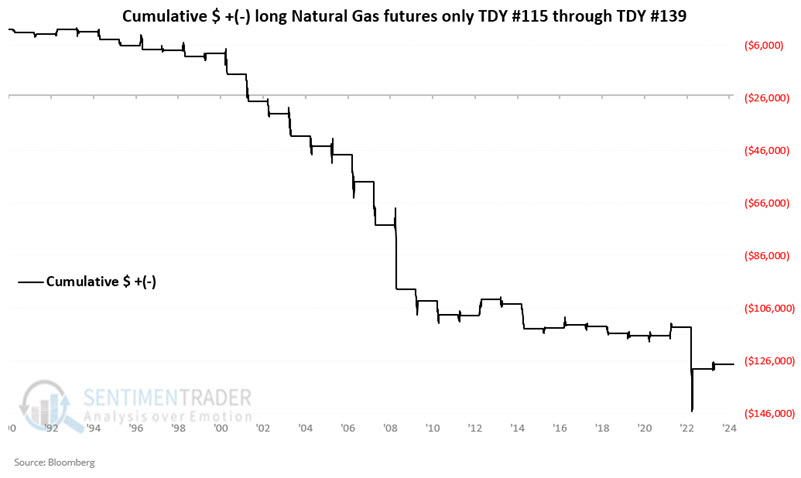
How challenging has this period been? The chart below displays the hypothetical cumulative $ +(-) achieved by holding a long position in natural gas futures during the TDY #115 through #139 period since 1990. Notice anything?
The table below summarizes natural gas futures performance during this period.
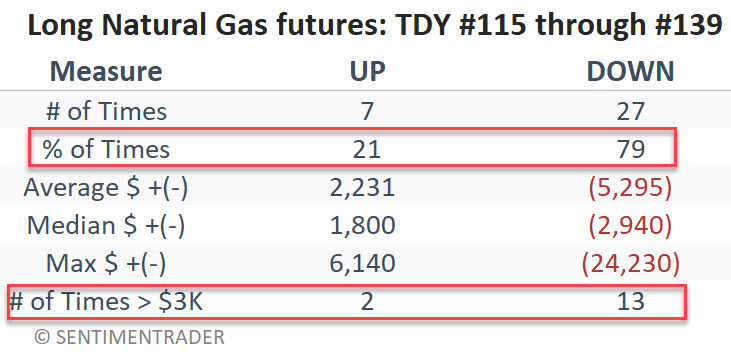
A 21% Win Rate reminds us that a price decline during this period is not a sure thing. Nevertheless, the overall results skew heavily negative.
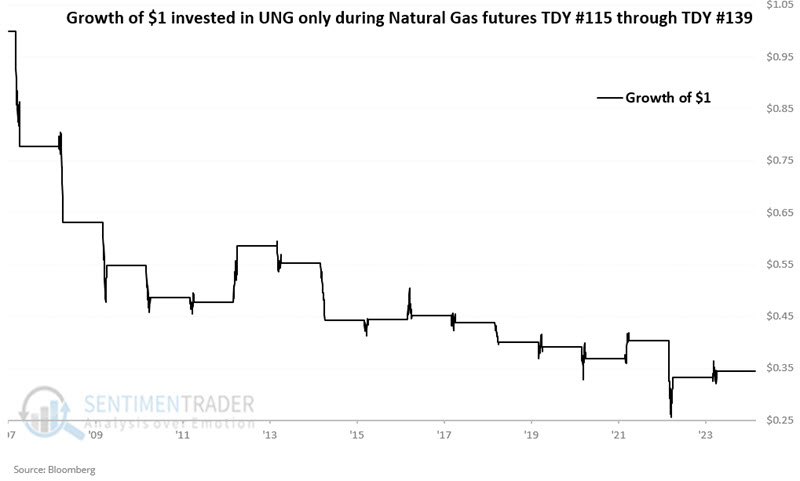
ETF ticker UNG tends to share in the misery
The United States Natural Gas Fund LP ETF (ticker UNG) is designed to track the price of natural gas futures. It should be no surprise that UNG results are just as ugly as those for future contracts.
The chart below displays the hypothetical growth of $1 invested in UNG only during the TDY #115 to #139 period every year since UNG started trading in 2007.
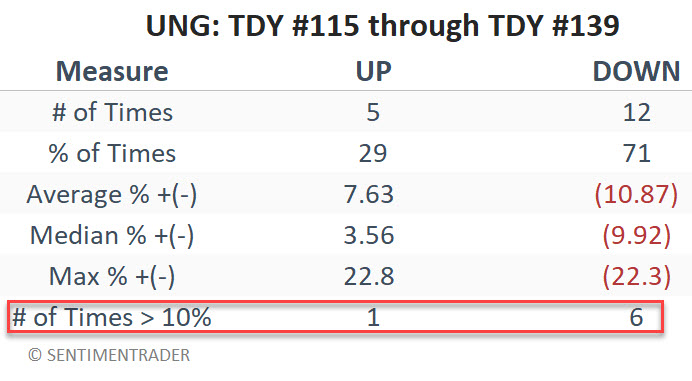
The table below summarizes UNG's performance during this period.
What to watch for?
Analyzing historical trends is our forte; "precision market timing" is not. Likewise, trying to "pick the top" in a market that is roaring higher is one of the easiest ways to quickly lose a lot of money. With these caveats firmly in mind, traders might watch the current advance in natural gas futures - and several momentum indicators - very closely.
The chart below displays natural gas futures along with the Chande Momentum Oscillator (9-period) and the Momentum Indicator (14-period). An "indicator divergence" occurs when price makes a new high but the indicator in question makes a lower high, i.e., the indicator does not confirm price action. Note two caveats here: First, drawing divergences on a chart can be somewhat subjective, and second, divergence is a "condition" and NOT an automatic "trading signal." That said, an examination of the chart below is replete with examples of these two indicators failing to confirm new rally highs in natural gas, followed by a sharp decline in price.
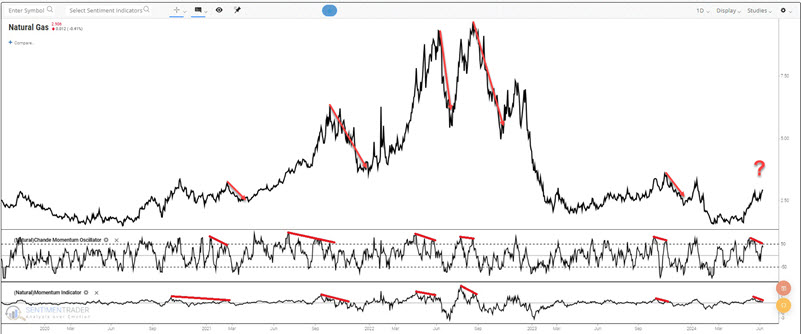
If natural gas runs out of steam and reverses with these two indicators failing to make new highs (i.e., above the indicator highs made in late May), an opportunity to play the short side of natural gas or ticker UNG may be at hand. Regardless of when a trader might choose to play the short side, significant consideration must be given to reasonable position sizing and a firm and inviolable stop-loss point to limit the risk of loss to a manageable amount if the market decides instead to run higher.
What the research tells us…
Remember, declining prices are not guaranteed to follow any seasonal trend and/or indicator divergence. With natural gas currently in an established uptrend, traders must decide whether to fade the trend, wait for some sign of a downside price reversal, or stand aside completely. History suggests that the month ahead is typically a good time for aggressive traders to look for a downside reversal as a signal to play the short side of natural gas.