
It's time to keep an eye on natural gas

Key points
- Natural gas has plummeted -76% in just six months
- This volatile - but highly cyclical - market is entering a favorable seasonal window
- ETF ticker UNG offers an alternative to trading riskier Natural Gas futures
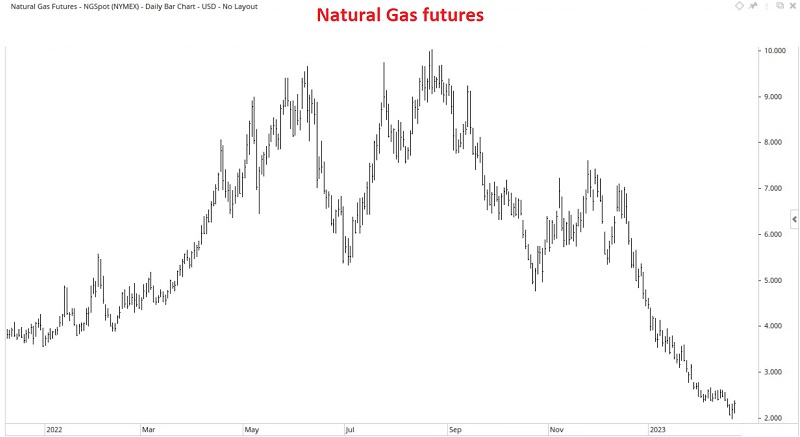
Natural Gas is a very volatile market
The daily chart below (courtesy of Optuma) displays Natural Gas futures price action over the past year, including the massive, free-fall decline of the last six months.
The following chart (monthly Natural Gas) highlights that what's happened in the last six months is not entirely uncommon for this highly volatile market.
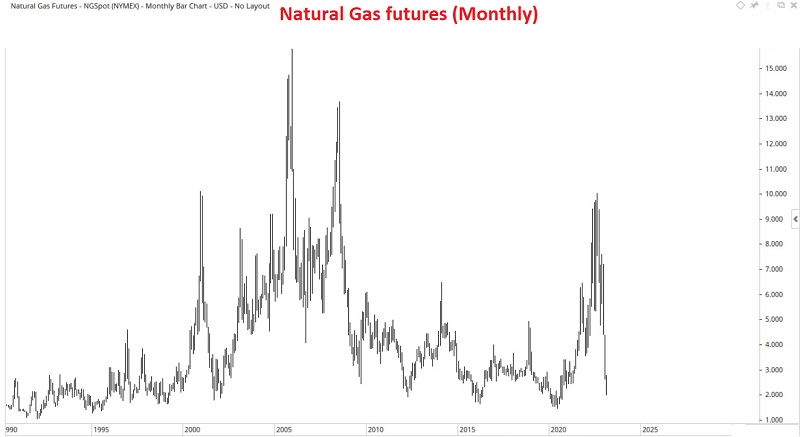
As it turns out, there is another reason that the recent decline should not have taken traders entirely by surprise.
Natural Gas is a highly seasonal market
The chart below displays the annual seasonal trend for natural gas futures (ticker NG).
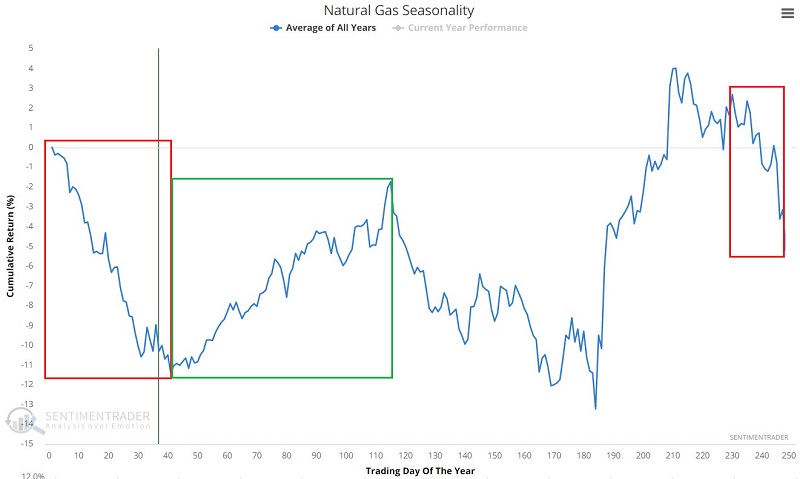
In this article dated 2022-10-25, I highlighted that although natural gas was oversold at the time, further downside was possible. That turned out to be an understatement. The critical thing to note is that Natural Gas is entering a favorable seasonal window. Note in the chart below that while December through February typically shows weakness, the March through May period tends to witness strength.
Let's take a closer look at historical performance during this timeframe.
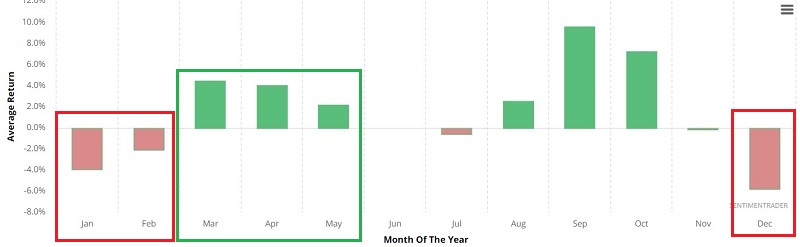
Entering a seasonally favorable period
The seasonally favorable period extends from the close of TDY #41 through the closing of TDY #115. Note that the contract we follow from Bloomberg tracks spot Natural Gas futures, which can include trading days where electronic trading takes place even if that day is considered a market holiday.
For 2023, this period extends from the close on 2023-02-28 through 2023-06-12.
The chart below displays the cumulative hypothetical performance from holding long one Natural Gas futures contract only from the close on TDY #41 through TDY #115 every year since 1990, when NG futures started trading.
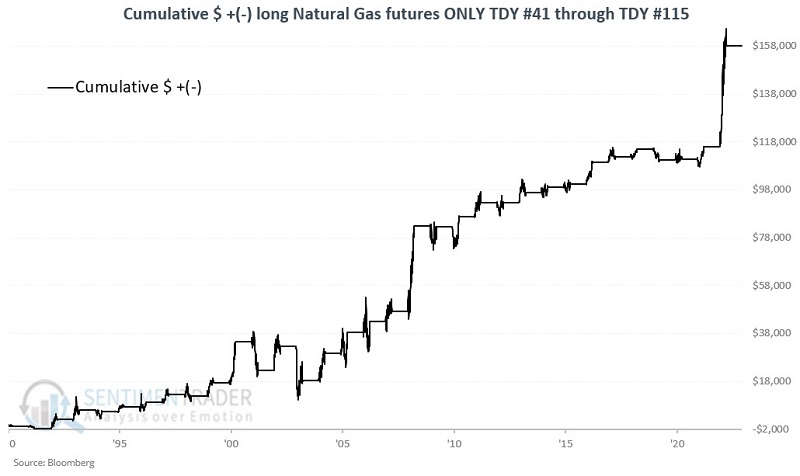
The table below summarizes performance results during this favorable seasonal period.
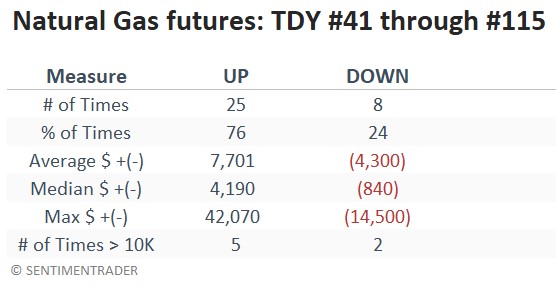
The good news is that historical results have been quite favorable overall. The bad news is that there is no guarantee that future results will be similar. Likewise, the fact remains that Natural Gas futures are inherently very volatile and require very deep pockets (and a solid understanding of the unlimited risk inherent in futures trading) to trade.
Using an ETF as an alternative
The United States Natural Gas Fund (UNG) is an exchange-traded security designed to track in percentage terms the movements of Natural Gas futures prices. UNG issues shares that may be bought and sold like shares of stock.
The futures contracts held by ticker UNG are based on its own prescribed roll schedule. This means that the daily percentage fluctuation in UNG may differ from those of the spot contract we used above to track NG futures directly.
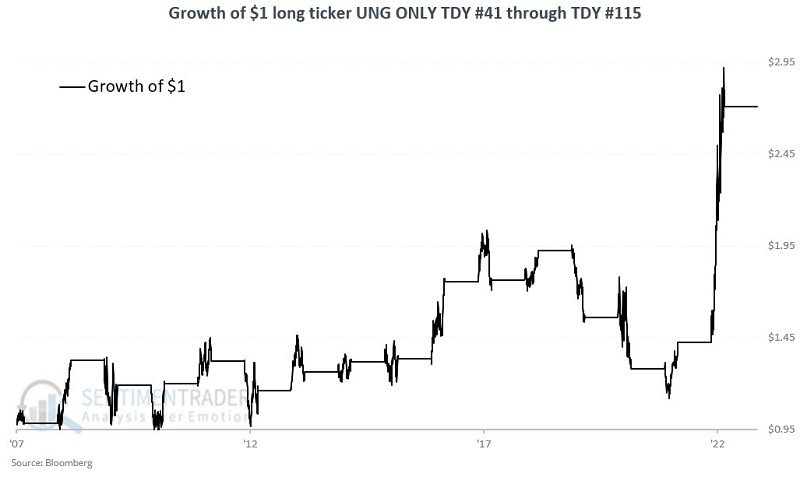
The chart below displays the growth of $1 invested in UNG only from the close of TDY #41 through TDY #115 for Natural Gas futures.
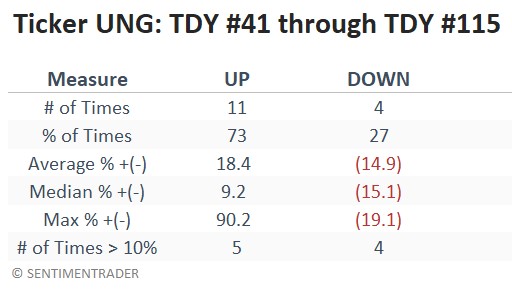
The table below summarizes performance results during this favorable seasonal period.
What the research tells us…
Natural Gas is a highly cyclical market. It tends to show weakness during the winter months of December through February and strength from late winter into spring. That said, traders must recognize the exceptionally volatile nature of Natural Gas futures. Nonfutures traders who wish to play the long side of Natural Gas can look to ticker UNG, with the caveat that returns for the ETF have not been as robust as those for the futures themselves.