
It's time to keep an eye on healthcare

Key points
- Many indicators are giving favorable signals for the healthcare sector
- These individual signals do not constitute an outright buy signal, but serve rather as weight of the evidence
- The "secret ingredient" for healthcare is the action of industry insiders
Sentiment flashes a green light for beaten-down healthcare
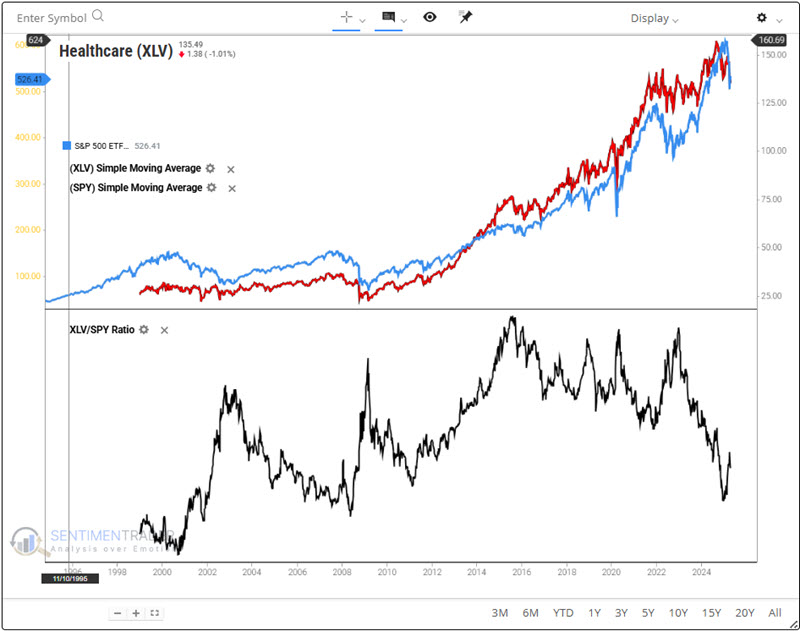
Over the long term, the healthcare sector has been a top - and relatively consistent - performer. However, the Health Care Sector SPDR Fund (ticker XLV) is essentially unchanged since August of 2021. The red line in the top clip of the chart below displays XLV price performance. The black line in the bottom clip displays XLV performance relative to the S&P 500. Note the sharp decline in relative performance from January 2023 to December 2024. Strong actual and relative performance by XLV has typically followed previous similar decreases.
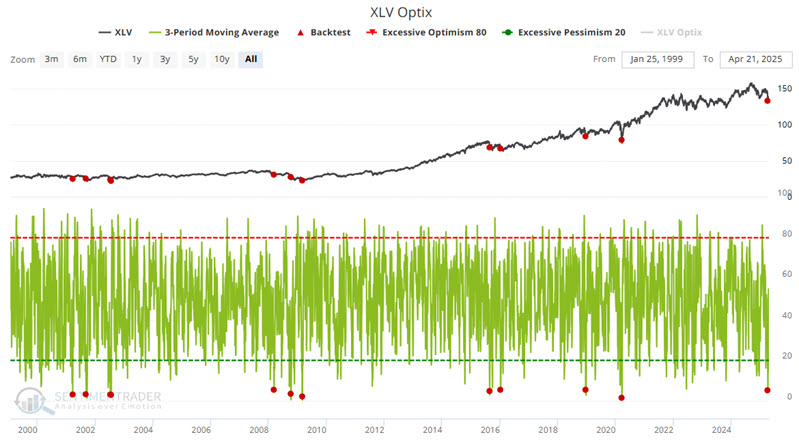
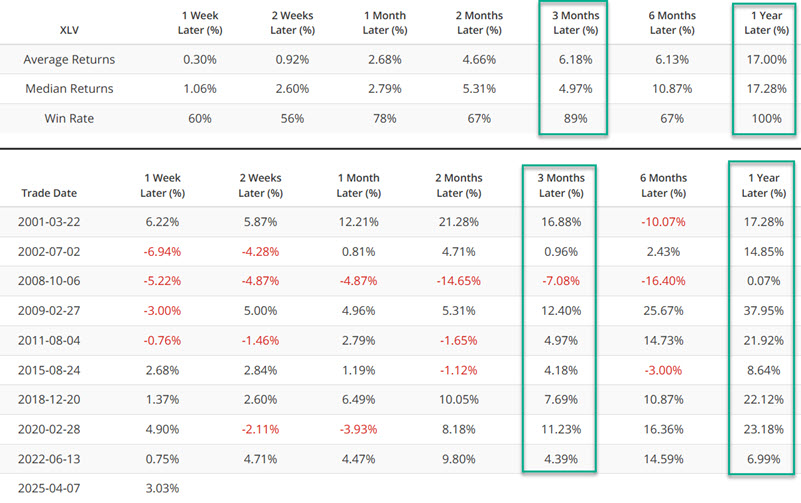
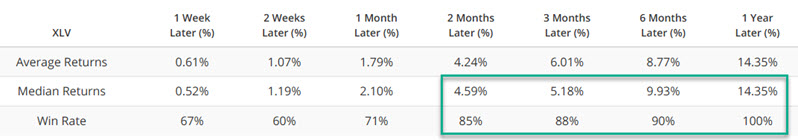
Unsurprisingly, investor sentiment has become severely depressed in the healthcare sector. The chart below highlights all dates when the 3-day moving average for our XLV Optix indicator dropped below 5.5%.
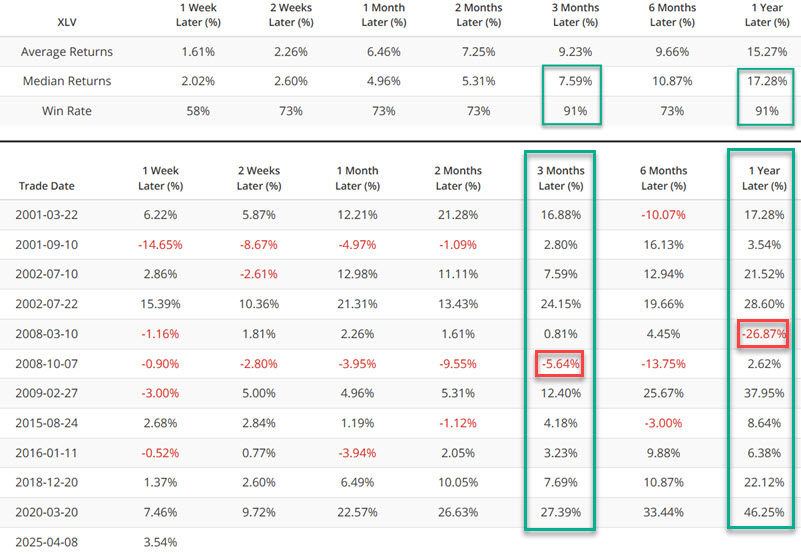
The table below summarizes subsequent XLV performance.
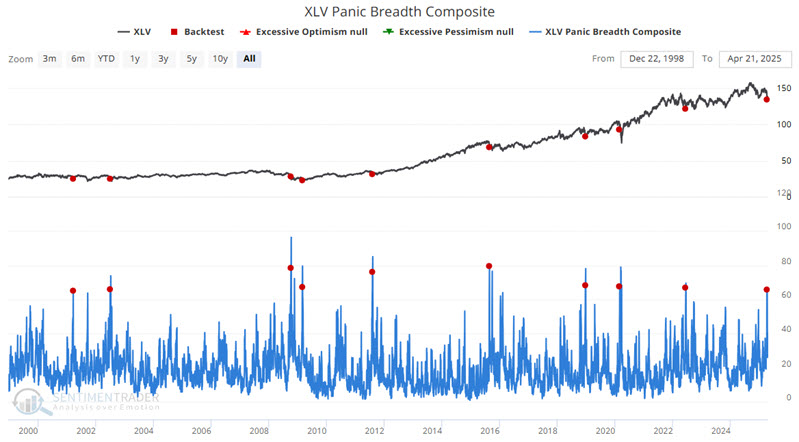
The XLV Panic Breadth Composite indicator combines market sentiment and breadth analysis to identify investors' "hair on fire" behavior. The chart below highlights dates when the XLV Panic Breadth Composite crossed above 65 for the first time in three months, and the table summarizes subsequent XLV performance.
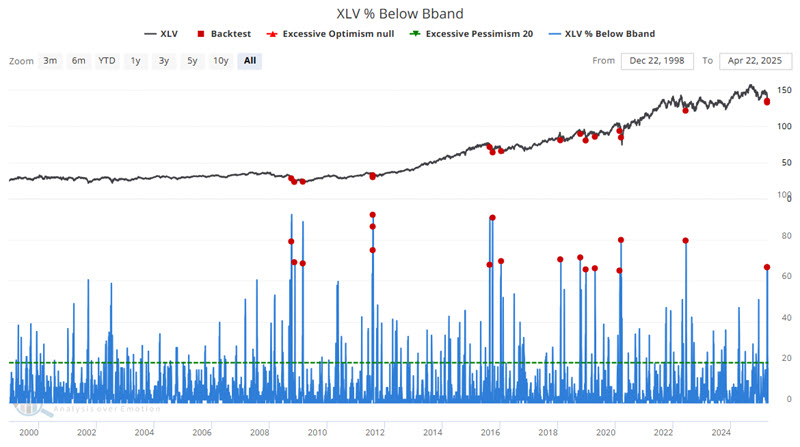
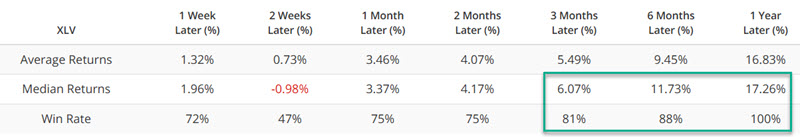
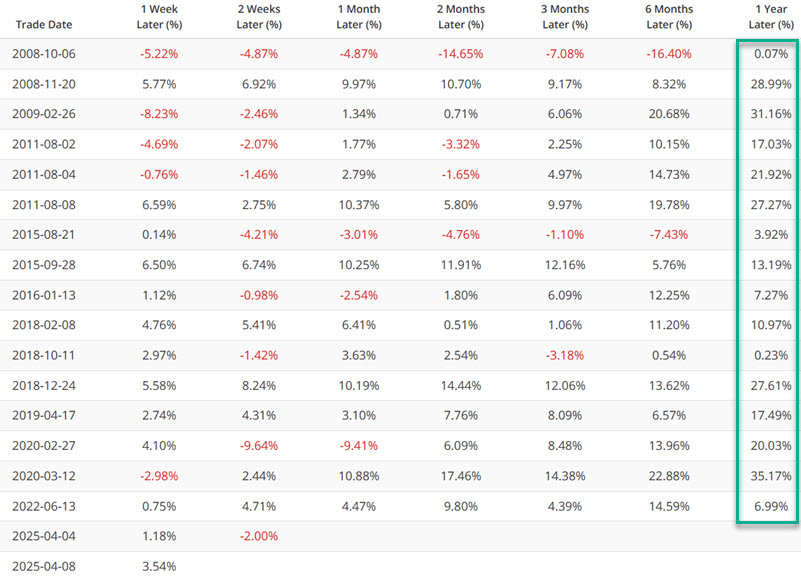
Speaking of breadth, the chart below highlights those dates when the XLV % Below BBand (i.e., the percentage of XLV constituent stocks that closed below their Bollinger Band) indicator crossed above 65%. This is typically indicative of a "washout." The table summarizes performance.
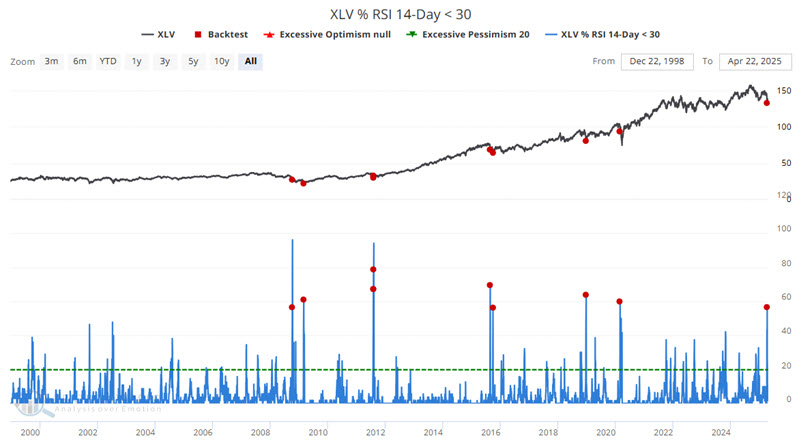
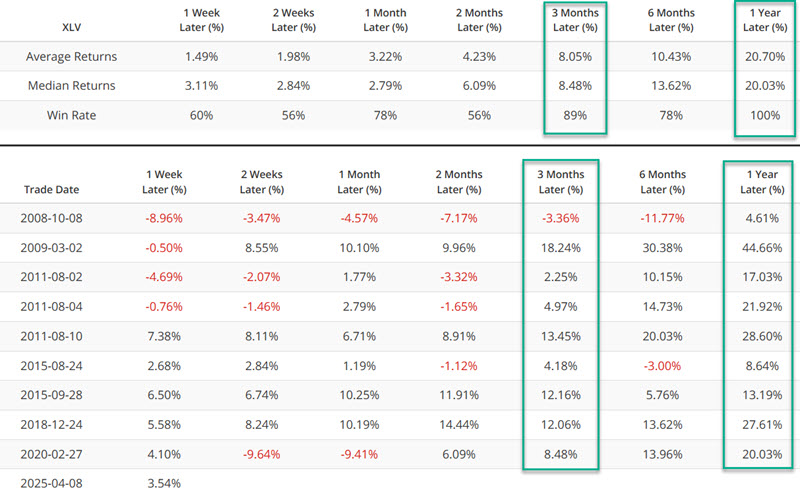
Let's consider one more breadth washout type of signal. The chart below highlights all dates when the XLV % RSI 14-Day < 30 (i.e., the percentage of XLV constituent stocks with a 14-day RSI of 30 or lower) indicator crossed above 56%. The table summarizes performance results.
New highs versus new lows also highlight an extreme condition
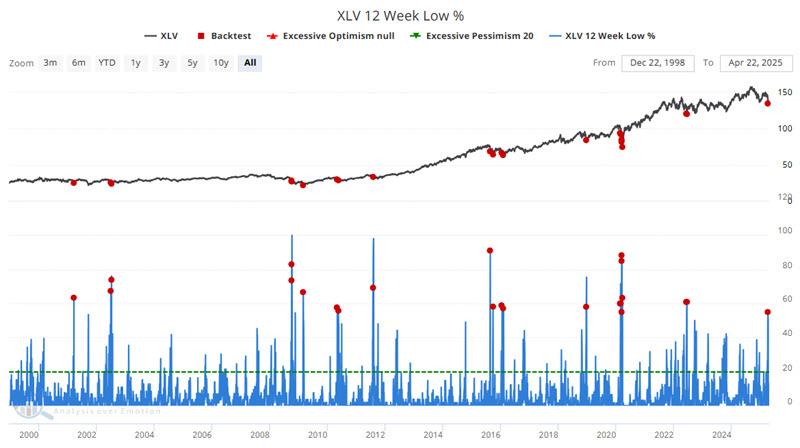
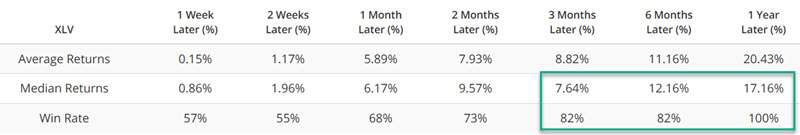
The XLV 12 Week Low % indicator shows the percentage of XLV constituent stocks currently trading at a 12-week low. The chart below highlights all dates when the indicator value crossed above 55. The table summarizes subsequent performance.
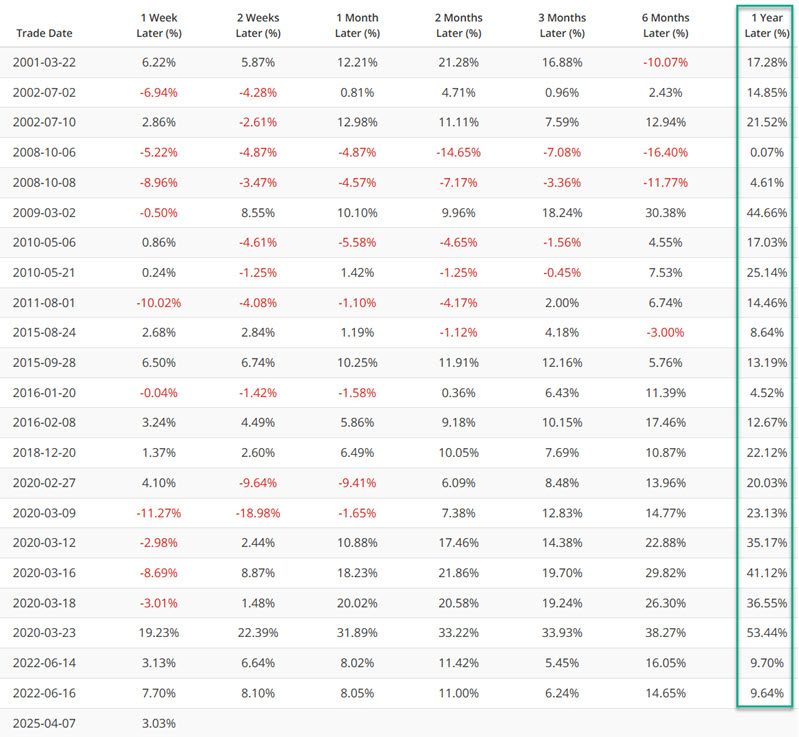
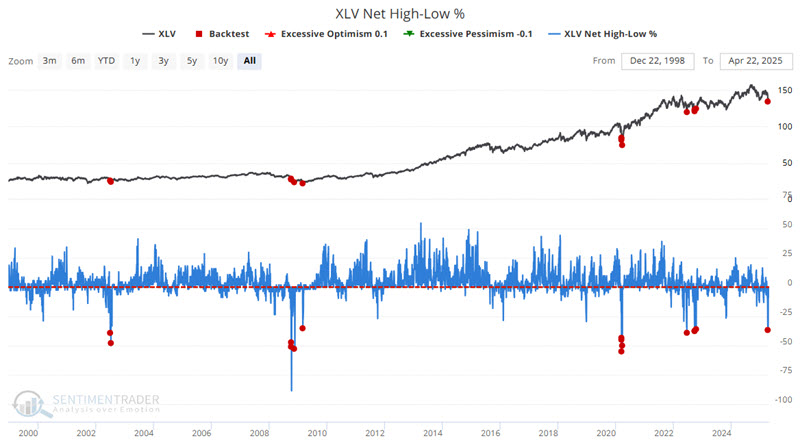
The chart below highlights all dates when the XLV Net New High-Low % indicator crossed below -35% (indicating a vast preponderance of sector stocks making new 52-week lows relative to those making new highs).
Insider buying is the "secret ingredient" for healthcare
Healthcare is not the only sector that is showing a lot of "favorable indicator signals" lately. However, insider buying is the one thing that it has witnessed that other sectors have not. Breadth and sentiment indicators can alert us that the selling in a given sector may be overdone. However, a significantly favorable relationship between insider buying and selling indicates that the people who know their companies' - and the industry as a whole - best are seeing value while others are panicking.
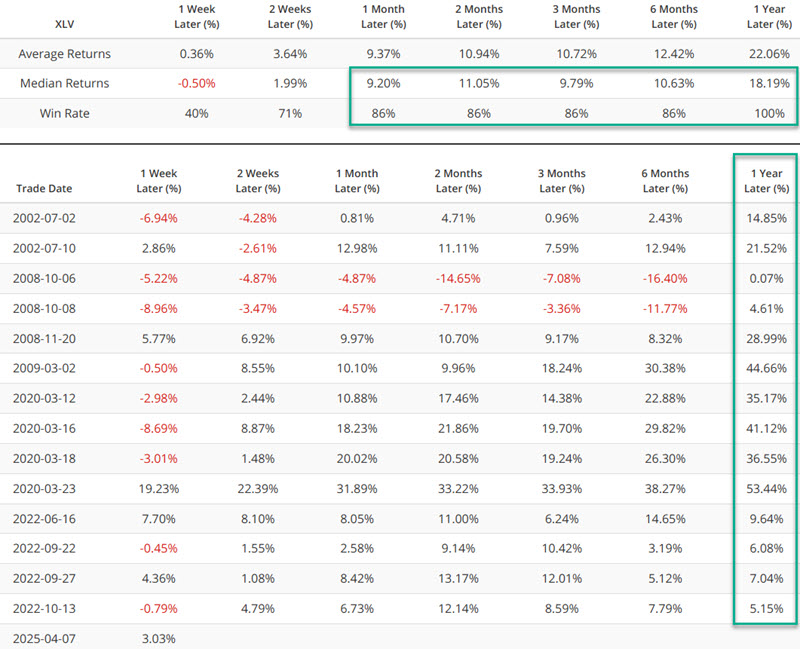
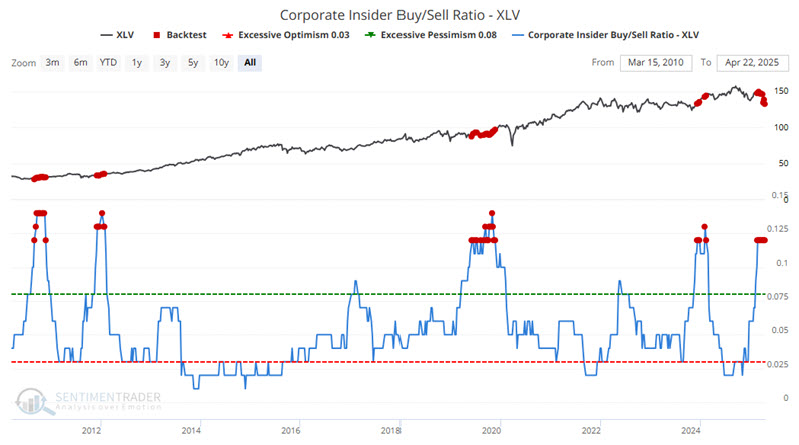
The chart below highlights all dates when our Corporate Insider Buy/Sell Ratio - XLV was above 0.12. The table summarizes XLV's performance.
While insiders are generally not "precision market timers," they are rarely wrong 1-3 years later.
What the research tells us…
We cannot say that the healthcare sector is sure to advance in the year ahead, despite all of the "favorable indicator signals" highlighted above. We can say that a great deal of "weight of the evidence" is piling up on the favorable side of the ledger. We can also factor in that healthcare corporate insiders view the prospects for the shares of their company as attractive in the year ahead and possibly beyond. All of this strongly suggests that investors take a closer look - and keep a close eye on - the healthcare sector for a buying opportunity.