
It's time to keep an eye on gold miners

Key points
- Gold is threatening to breakout to new all-time highs
- The gold miner sector has rallied over 60% since September 2022
- While all the momentum is presently to the upside, several sentiment and breadth indicators are suggesting that caution may be in order
The current state of affairs
The chart below (courtesy of AIQ TradingExpert) shows ETFs representing gold and gold miners.
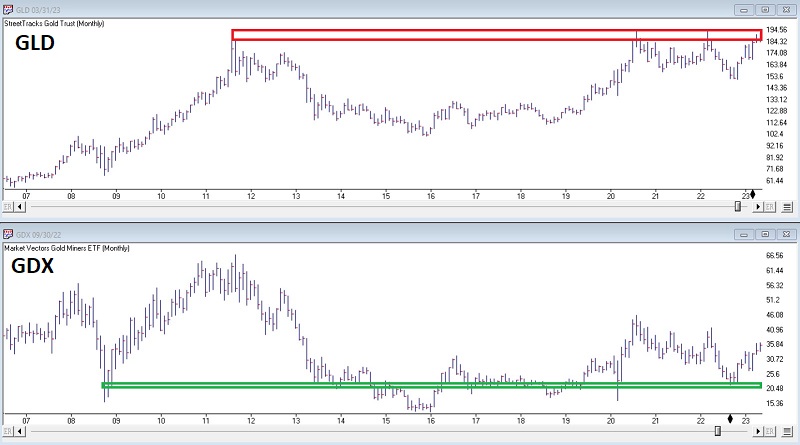
The top chart shows SPDR Gold Trust (ticker GLD), which tracks the price of gold. As you can see, it is attempting to break out to the upside, and if it does, there is no telling how far it could run. The bottom chart shows the VanEck Gold Miners ETF (ticker GDX) that tracks the gold miner sector. This ETF put in an important bottom in September 2022 and has rallied sharply since.
And from there, the arguments begin. Some argue that gold will break out and run to sharply higher all-time highs, while others say that resistance will hold and that gold will break back down. Regarding gold miners, some argue that the mining sector will outperform the metal itself if gold breaks out, while others say that the latest rally has gone too far, too fast. As usual, we will avoid these debates and focus on a specific group of objective indicators. At the moment, they appear to be urging caution - though we will also highlight one indicator to watch for a bullish confirmation signal.
Seeasonality is an initial overarching concern
The chart below displays the annual seasonal trend for ticker GDX. The cause for concern is obvious, as the June through October period tends to show significant weakness.
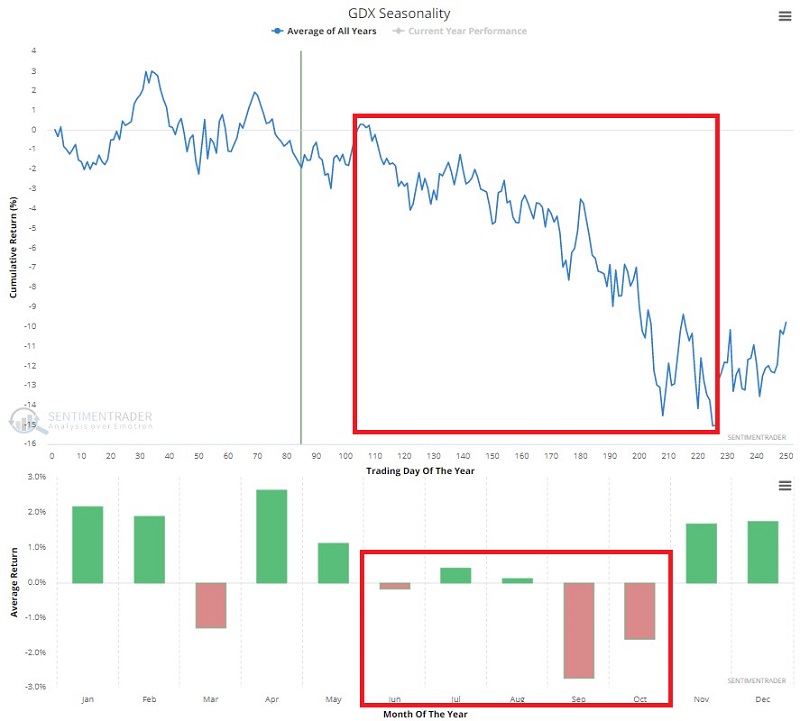
As always, the annual seasonal trend only represents an average of what has happened in the past, and is not a roadmap for the current year. In a truly bullish environment, a given asset can easily ignore a bearish seasonal tendency. That said, if gold and gold miners do not break out to the upside soon, this chart argues for potential trouble in the months ahead.
Sentiment is getting a bit overdone
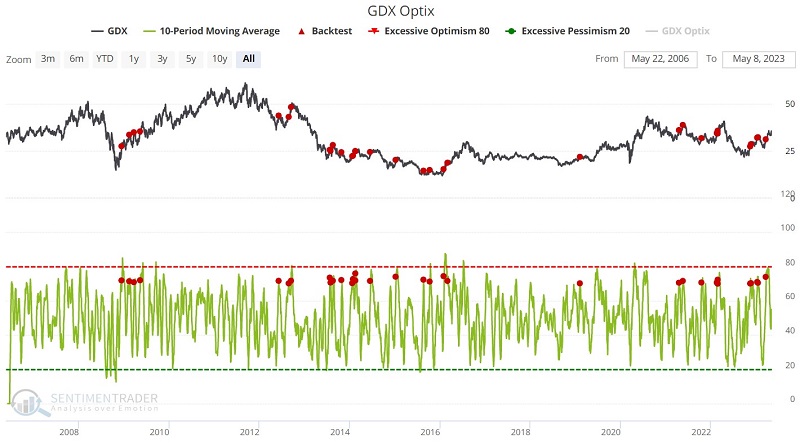
The chart below highlights with a red dot all dates when:
- The 50-day average for GDX Optix was above 60, and;
- GDX closing price > 150-day moving average
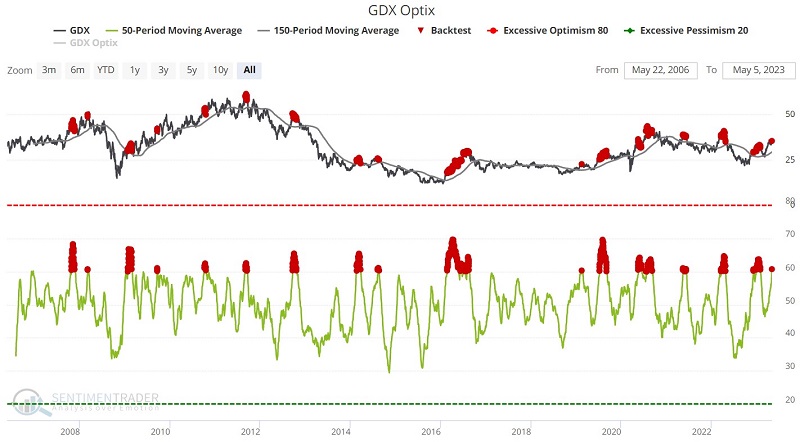
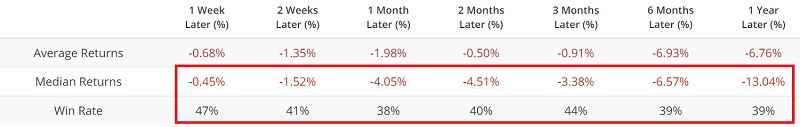
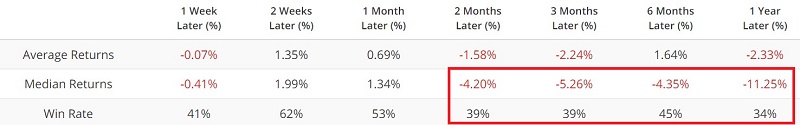
The table below summarizes GDX performance following previous signals. Note the tendency for weakness following such signals. The most recent signal occurred on 2023-05-05.
Another variation using GDX Optix identifies those dates when the 10-day average for GDX Optix crossed above 70. The chart and table below display the previous signals and GDX performance. Once again, results skew to the unfavorable side - but are not uniformly bearish. The most recent signal occurred on 2023-03-23.
Fund Flow crossed a significant extreme
The GDX Fund Flow indicator represents the daily flow into and out of the ETF. It is NAV-adjusted, so it better represents actual money moving into or out of the fund instead of just reflecting movement in the fund price itself.
The chart and table below highlight when GDX Fund Flow 20-day ma crossed above 22 for the first time in 2 months.
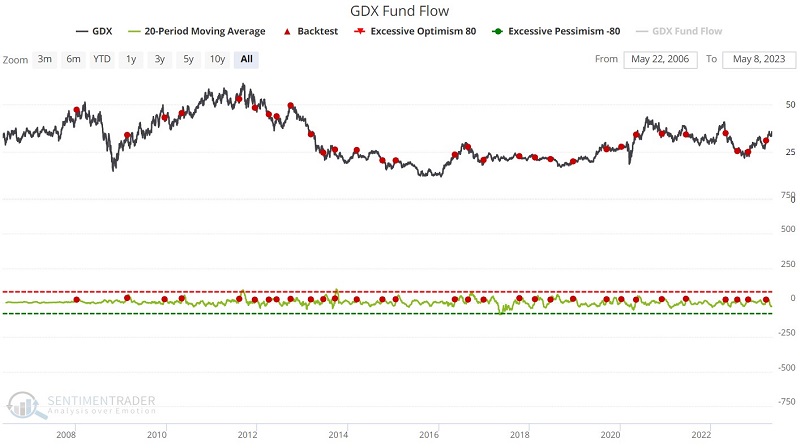
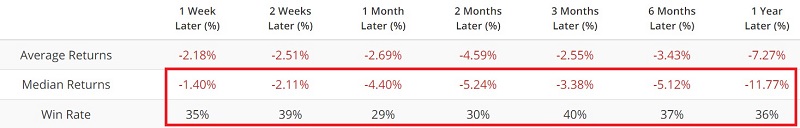
As with the previous indicators, results skew slightly to the unfavorable side. The most recent signal occurred on 2023-03-20.
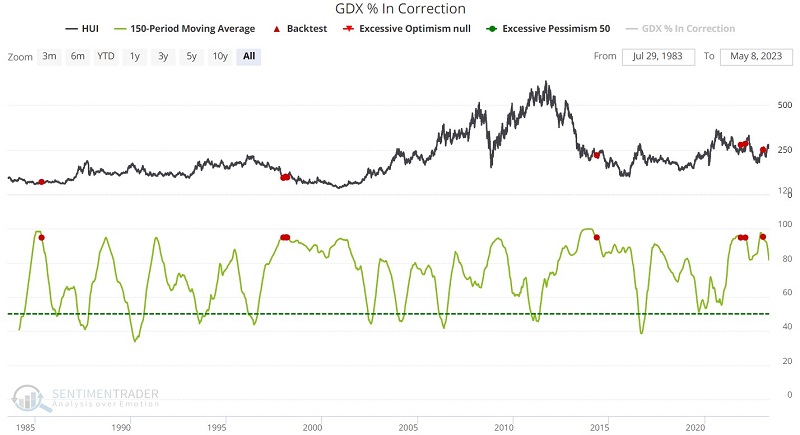
GDX % in Correction reaches an extreme
This indicator shows the percentage of the GDX ETF components that are trading more than 10% below their 52-week highs. For this test, we use the 150-day moving average and highlight those times when this long-term average crossed below 95. Intuitively, this seems like it should be a bullish signal. But the reality is quite different. While two and three-month returns were positive, six and twelve months have been uniformly negative.
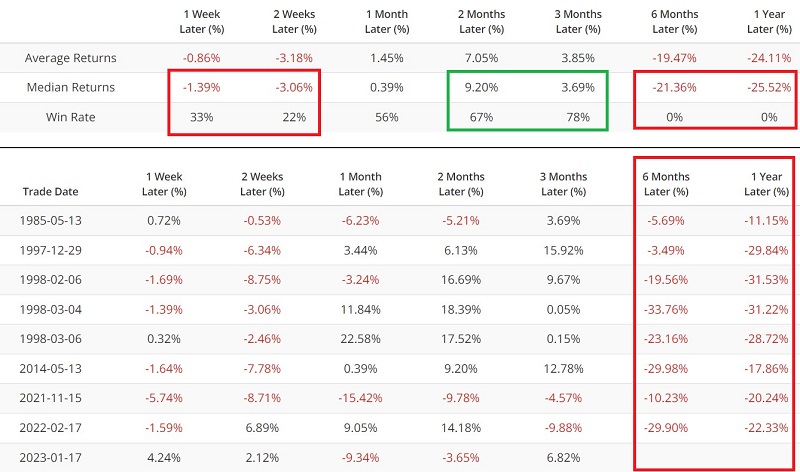
The most recent signal occurred on 2023-01-17. So far, GDX has managed to advance a little more than 5% since then. But if the six and 12-month historical patterns hold true this time, miners could see some significant downside in the next several months. That does not constitute a prediction; it merely highlights the importance of paying close attention to miners in the near term for important clues.
GDX Breadth potentially giving mixed signals
The GDX Breadth (% > 200 Day Avg) indicator shows the percentage of the GDX ETF components trading above their 200-day moving averages. The first test highlights those dates when this indicator was above 93.9. The most recent reading above 93.9 occurred on 2023-04-25.
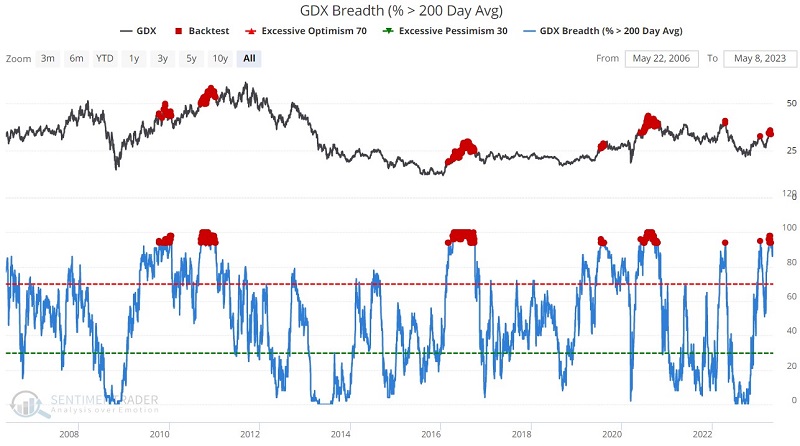
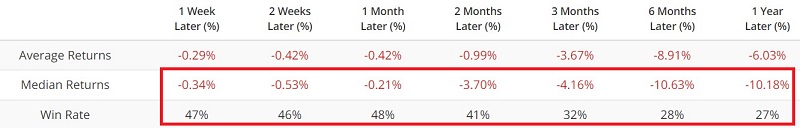
These results show more of the same - a tendency for negative returns, but with some notable exceptions.
Potential signs to ignore the bearishness above
So far, the indicators above suggest potential trouble ahead for gold miners. But there is one two-part scenario that might suggest that investors can watch for that would suggest that this might be a favorable exception for the indicators above:
- The first part will be if GLD does close above the resistance levels highlighted in the first chart above and manages to hold that level and perhaps sees the current resistance level turn into a support level.
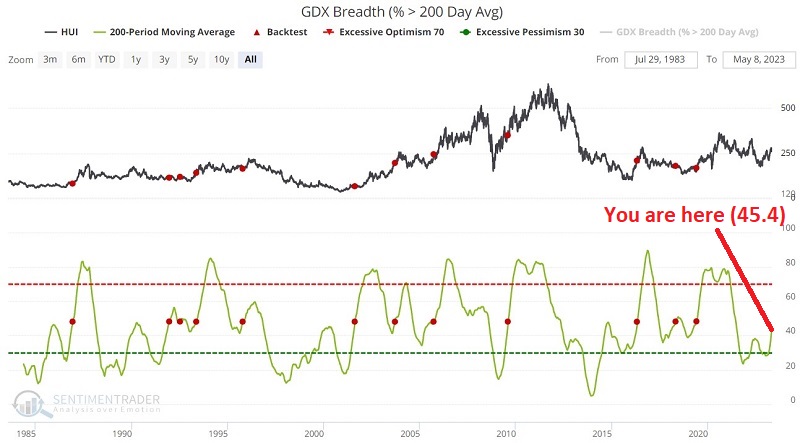
- The second sign of bullish confirmation could come from a different take on the last indicator we just looked at. The test below highlights those dates when the 200-day average of the GDX Breadth (% > 200 Day Avg) indicator crosses above 48 for the first time in six months.
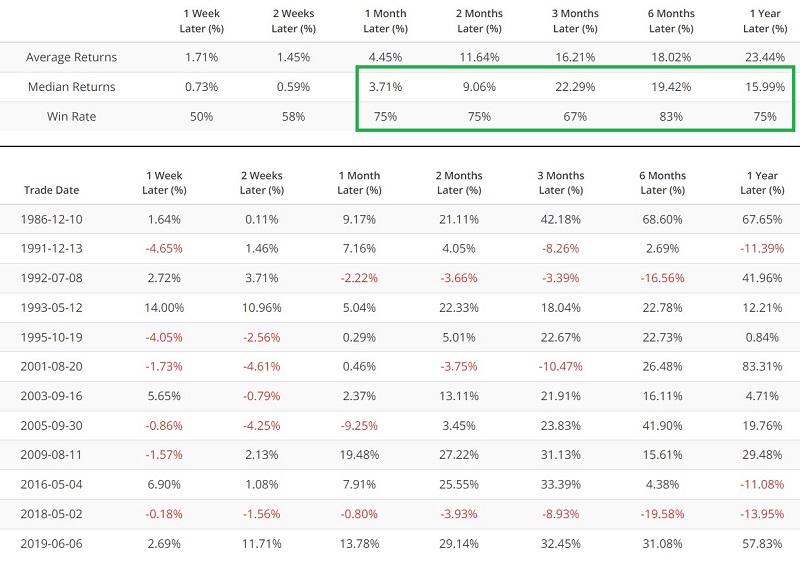
As you can see in the chart and table below, gold miner performance tends to skew favorably. The 200-day average presently stands at 45.43. The longer the gold miner sector can hold its ground, the greater the likelihood of a bullish cross above 48.
What the research tells us…
The gold miner sector has a volatile history and can trend sideways or lower for years at a time. Nevertheless, miners also hold the potential for well above average returns - particularly if gold bullion can break out to new highs and hold in the new high territory. There are two scenarios to watch for.
In the first, gold breaks out to the upside, and the 200-day average for our GDX Breadth (200 Day Avg) indicator crosses above 48. In this scenario, we may see favorable exceptions to the unfavorable tendencies highlighted for most of the abovementioned indicators. However, if gold fails to break out soon - or does so only briefly and then reverses - the potential for disappointment (and a potentially substantial decline in gold miners) increases significantly.