
It's time to keep an eye on emerging markets

Key points
- The bad news: Emerging markets as an asset class have been trending sideways for literally 17 years
- The good news: The back-and-forth-nature of its movements does offer opportunities for shorter-term traders
- Ticker EEM could be breaking out above a narrowing channel just as a short seasonally favorable window opens
Emerging markets have been "dead money"
Regarding long-term investors, the chart below tells you everything you need to know regarding emerging markets as an asset class.
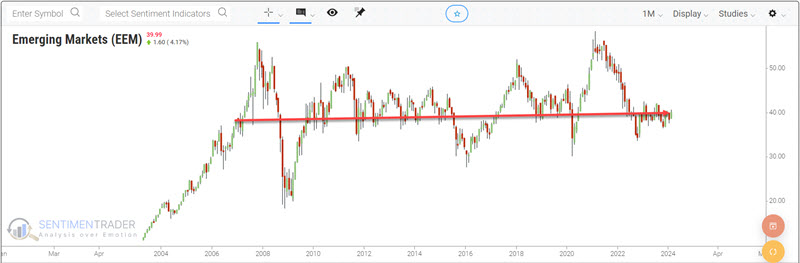
The iShares MSCI Emerging Markets ETF (ticker EEM) is unchanged in price from its level 17 years ago. Most investors have long written off this niche asset class as a viable investment alternative. And understandably so. Still, short-term traders have a slightly different take. The constant up-and-down action of EEM's price can offer many trading opportunities. One such opportunity may be forming at the moment.
In the chart below, we see the possibility that EEM is about to break out to the upside of an (admittedly subjectively drawn) narrowing channel. For believers in chart patterns, this alone may qualify as an opportunity.
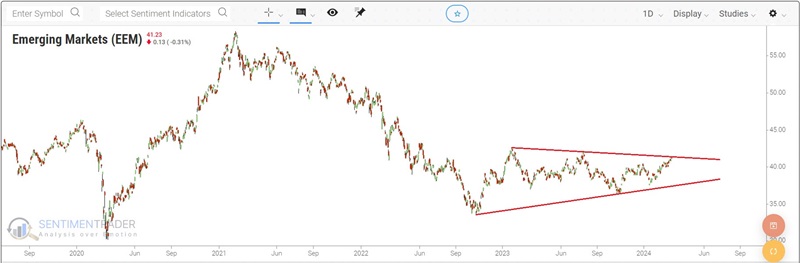
On the other hand, price hitting an "upper band" is often followed by a reversal lower back into the range. So, a breakout to the upside is essentially required to "confirm" an uptrend.
Other traders might require "something more" to consider EEM to be offering - or at least close to offering - a decent opportunity. So, let's throw "something more" into the mix.
Entering a seasonally favorable period
As always, seasonality is "climate, not weather" and also "a factor and not an automatic buy or sell signal." The chart below displays the annual seasonal trend for ticker EEM.
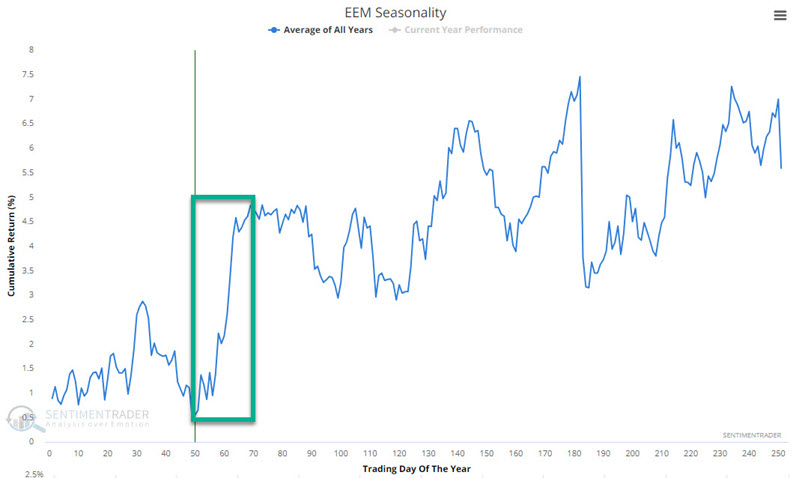
As you can see, EEM just entered a favorable seasonal period that extends from the close on Trading Day of Year (TDY) #49 through the close on TDY #69. For 2024, this period for EEM extends from the close on 2024-03-12 to the close on 2024-04-10.
A closer look at EEM performance
The chart below displays the growth of $1 invested in ticker EEM only from TDY #49 through TDY #69 every year since EEM started trading in 2003.
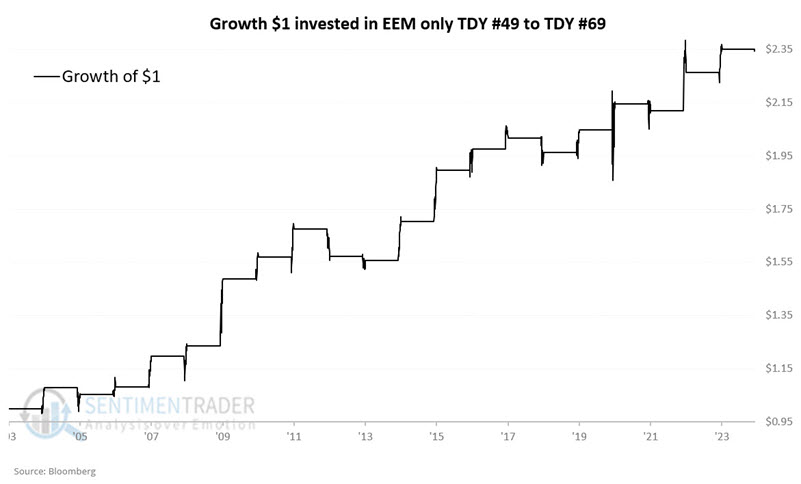
As with many seasonal trends, the "lower left to upper right" nature of the equity curve is unmistakable. However, as with all seasonal trends, there is no guarantee that things will play out as hoped this year.
The table below summarizes EEM's performance during this seasonal period.
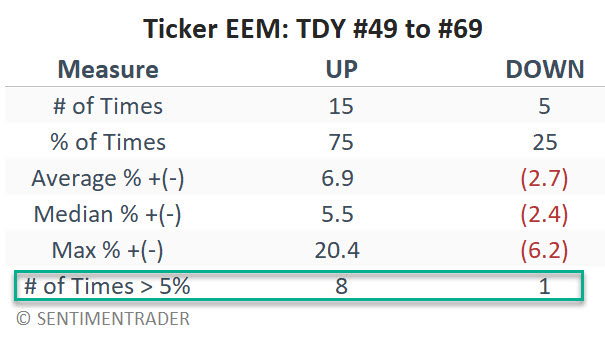
Overall, the long-term, seasonal results skew to the favorable side, with 3 out of 4 years showing a gain during the TDY #49 to #69 period. Likewise, regarding moves greater than 5% or more during this period, EEM is 8 and 1 to the plus side. The worst TDY #49 to #69 decline for EEM was -6.2% in 2012. The second worst loss was only -2.7% in 2018.
What the research tells us…
The good news is that a decent setup appears to be in place for emerging markets - assuming the price does break out to the upside. The bad news is that drawing lines on a bar chart never guarantees any outcome. Likewise, no seasonal pattern is ever guaranteed to follow its historical norm. EEM could quickly reverse back into its recent channel - or even break below the lower end.
But if EEM can break above its recent channel momentum, traders should look for an opportunity in ticker EEM in the month ahead.