
Its time to keep an eye on crude oil

Key Points
- Crude Oil has been trending lower since mid-2023. In recent months, crude has found support in the $68-$69 range
- This market is soon entering a favorable seasonal period
- Crude Oil can be traded via the futures market and or via an ETF
Crude Oil attempting to find a bottom
Crude Oil peaked in September 2023, then fell over $20 a barrel in three months. Since then, it has been trading sideways in a range with support in the $68-$69 range.
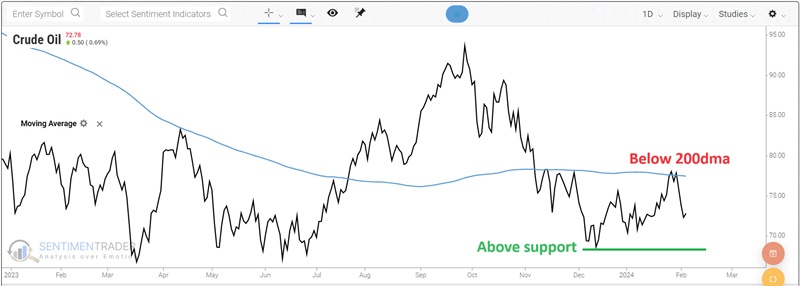
If price holds above support, an argument can be made for entering a long position once the next favorable seasonal period begins (more on that topic in a moment). At the same time, with the price holding below its 200-day moving average, an argument can be made for avoiding a long position.
What might tip the balance? One possibility is the upcoming favorable seasonal period.
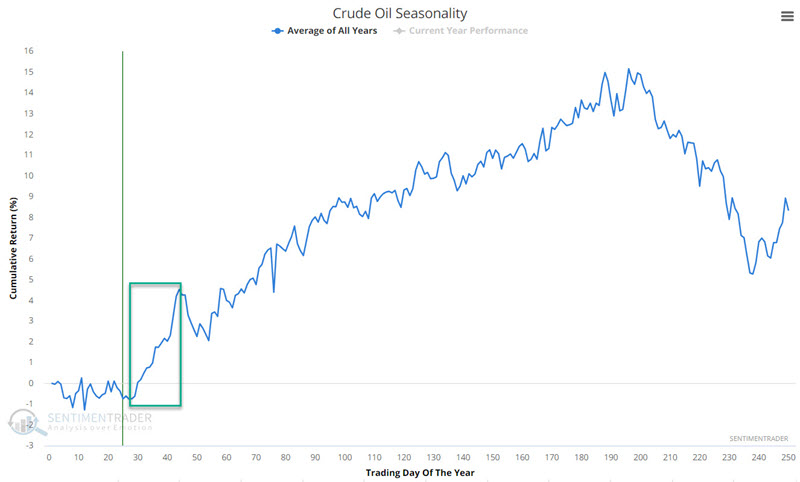
A favorable seasonal period for crude Oil
The chart below displays the annual seasonal trend for crude oil futures. Crude will soon enter a favorable seasonal period extending from the close of Trading Day of Year (TDY) #28 through TDY #44.
For 2024, this period extends from the close on 2024-02-08 through 2024-03-01.
The chart below displays the cumulative hypothetical $ +(-) achieved by holding a long position in crude oil futures during this period every year since 1983.
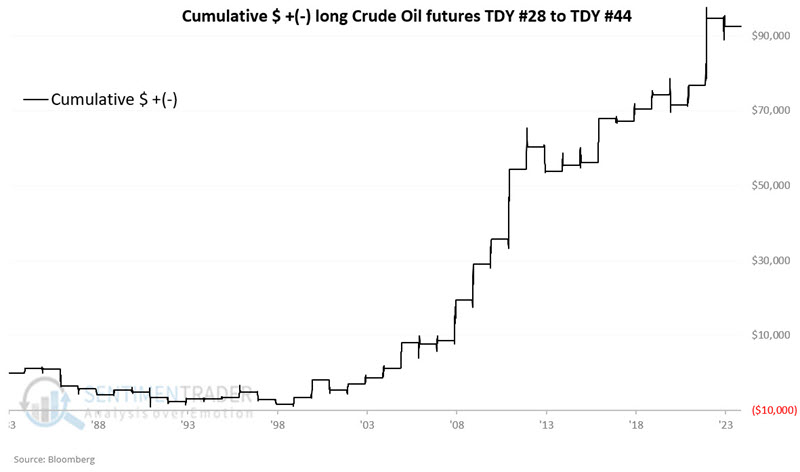
The table below summarizes crude oil performance during this period since crude oil futures started trading in 1983.
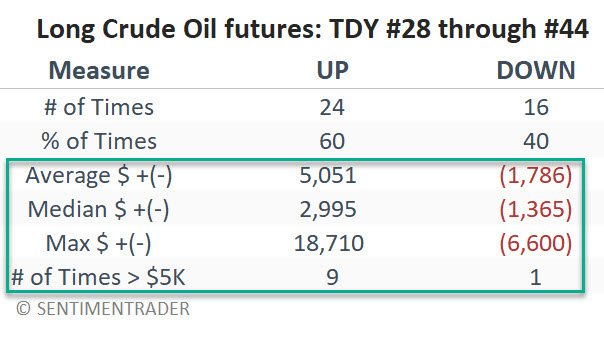
An overall 60% Win Rate is not spectacular, but it is worth noting that in the last 25 years, there have been 19 up periods and six down - a much more solid 76% Win Rate. Also, winning years have skewed more positively to the plus side than down years have to the losing side (Median gain of +$2,995 versus median loss of -$1,365 and $5K moves skewing 9 to 1 to the plus side).
Filtering for price trend
Results were more consistently positive when crude oil was above its 200-day moving average. The chart below displays the cumulative $ + (-) achieved by holding crude oil futures when:
- The TDY was between 28 and 44
- Crude Oil was above its 200-day moving average
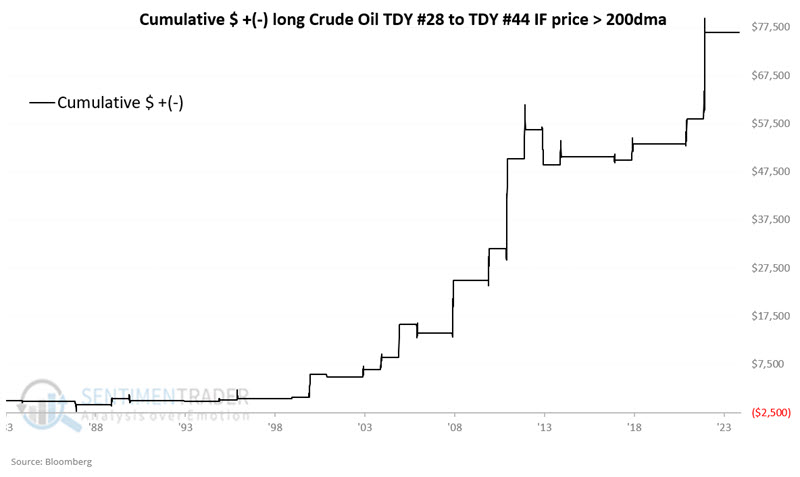
The cumulative gain was $76,500, and results trended consistently from lower left to upper right.
The chart below displays the cumulative $ + (-) achieved by holding crude oil futures when:
- The TDY was between 28 and 44
- Crude Oil was below its 200-day moving average
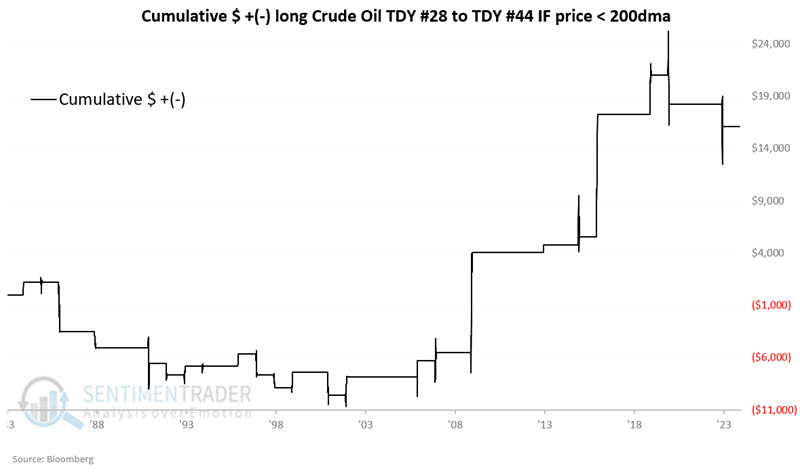
The cumulative gain was $16,150, and drawdowns and losing periods were much more prevalent. The implication is that a trader might improve their odds of success by trading crude oil during the upcoming favorable period once the price rallies above the 200-day moving average.
The tradeoff is that the 200-day moving average is presently $5 higher, which could mean foregoing a significant portion of profit if crude oil rallies. Aggressive traders might consider jumping in without confirmation, while less aggressive traders might wait for price confirmation.
An ETF Alternative
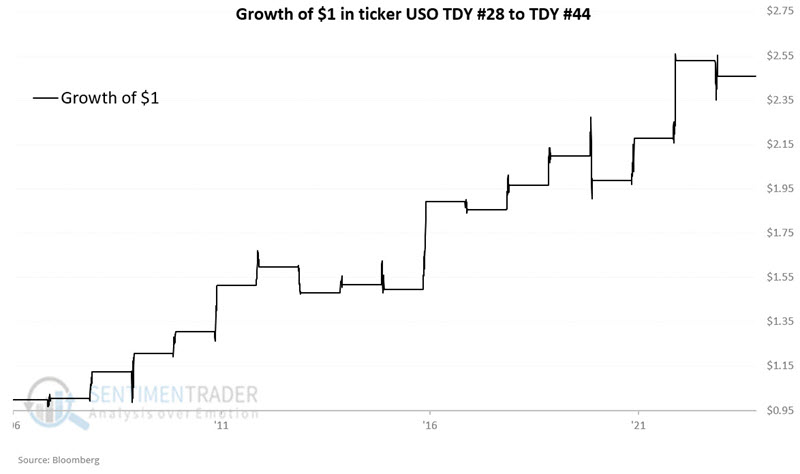
A $1 move in the price of a crude oil futures contract equates to a $1,000 change in contract value. Likewise, a position in crude oil futures involves essentially unlimited risk. As a result, most individuals will never (and probably should never) contemplate trading crude oil futures. However, a trader can still gain exposure to the crude oil market via an ETF. The most heavily traded Crude Oil ETF is the United States Oil ETF (ticker USO).
The chart below displays the hypothetical growth of $1 invested in USO only during the exact dates as crude oil in the chart above.
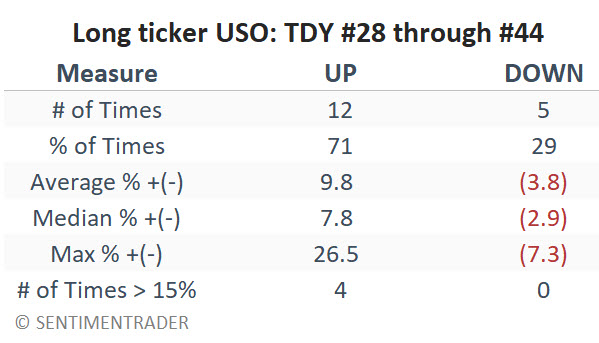
The table below summarizes USO's performance during this favorable seasonal period.
What the research tells us…
As always, seasonality is "climate, not weather." The fact that crude oil will soon enter a "Favorable" seasonal window does not guarantee that a rally is imminent. But it does strongly suggest that traders be alert for a trading opportunity. As long as crude oil holds above recent support - and especially if it can cross back above its long-term moving average - crude oil traders might do well to be open to an opportunity to trade the long side in the weeks ahead.