
It's time to keep an eye on crude oil

Key Points
- Crude oil has staged a terrific rally since the April 2020 low
- Conventional wisdom seems to argue that the price of crude will continue to march higher
However:
- Crude oil Optix is signaling a reversal from an extreme reading
- Crude oil futures term structure has reached an unfavorable level
- Energy stocks have gotten overbought
None of the factors discussed in this piece means that the bull market in crude oil has ended. But taken together, they do suggest that the oil market may soon become a much more volatile affair and less of a one-way street.
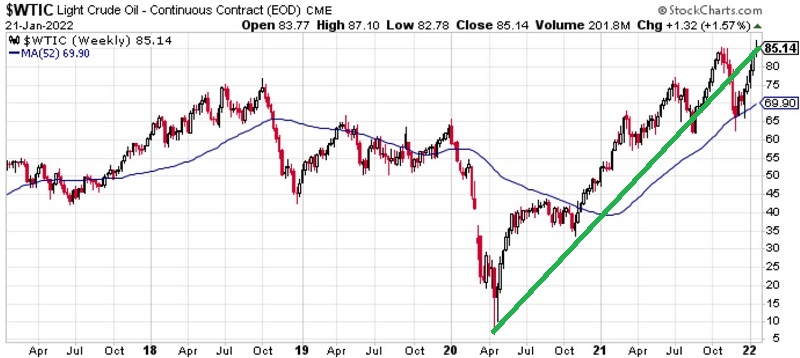
Respecting the trend
The chart below (courtesy of Stockcharts) displays a 5-year weekly chart for West Texas Intermediate Crude. The powerful post-Covid low advance is highlighted with a green arrow.
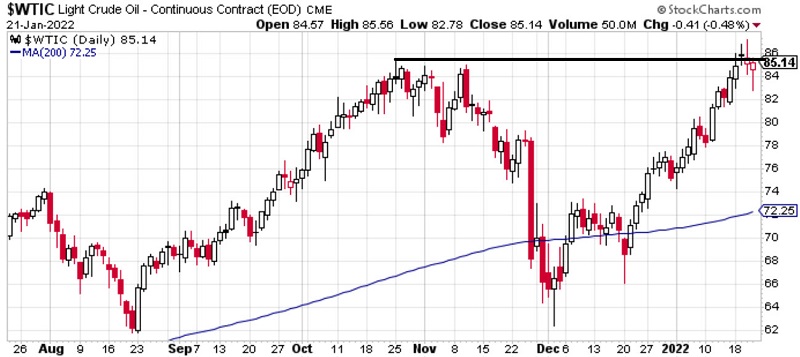
Selling or selling short into the teeth of this type of advance entails a great deal of risk. Still, the daily chart of WTIC below shows that crude recently tried to break out to a new high and failed. This creates a natural resistance level. Until crude breaks out above this line, the near-term trend is neutral at best.
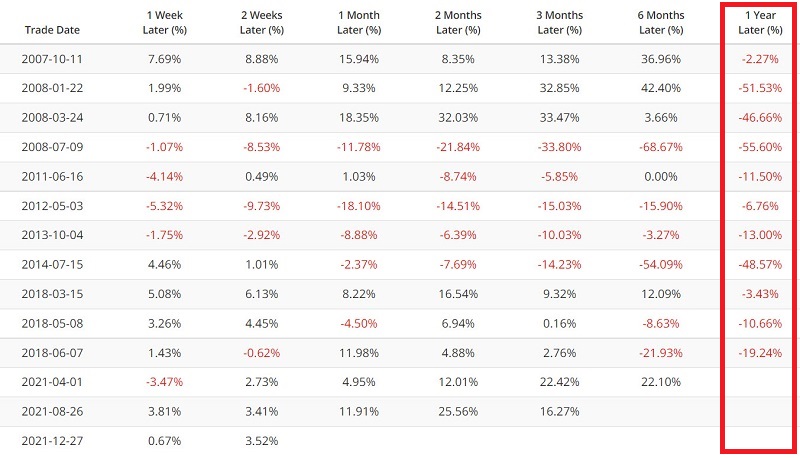
Crude Oil Optix
The chart below displays those times when the 50-day average for our crude oil Optix indicator dropped below 60. You can run this test in our Backtest Engine.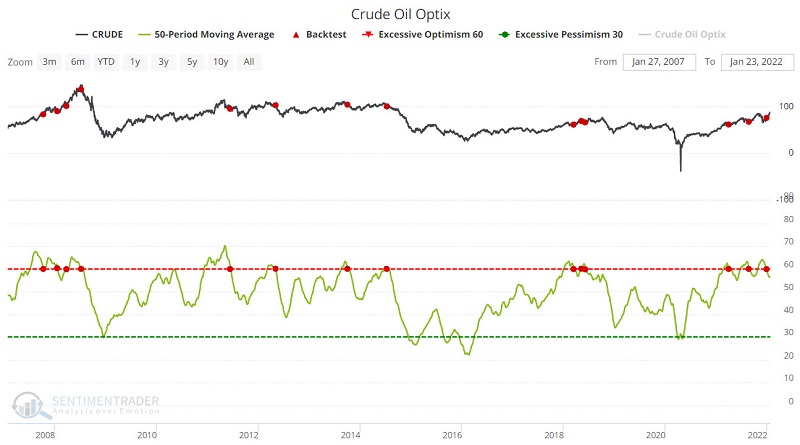
The table below displays a summary of results following previous signals. Note that results are "OK" for the first three months. After that, results tended to fall off significantly.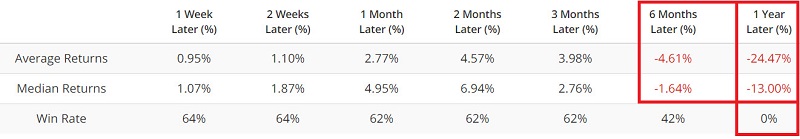
The table below displays the dates of previous Optix signals and the returns for crude oil.
Crude Oil Term Structure
The term structure of crude oil futures shows the relationship of the near-term futures contract to a further-out contract. If it is above 1.0, the near-term contract is priced higher than the further-out contract, called backwardation. If it is below 1.0, the near-term contract is priced lower than the further-out contract.
The chart below displays those times when the crude oil terms structure rose above 1.05 for the first time in 21 days. You can run this test in the Backtest Engine.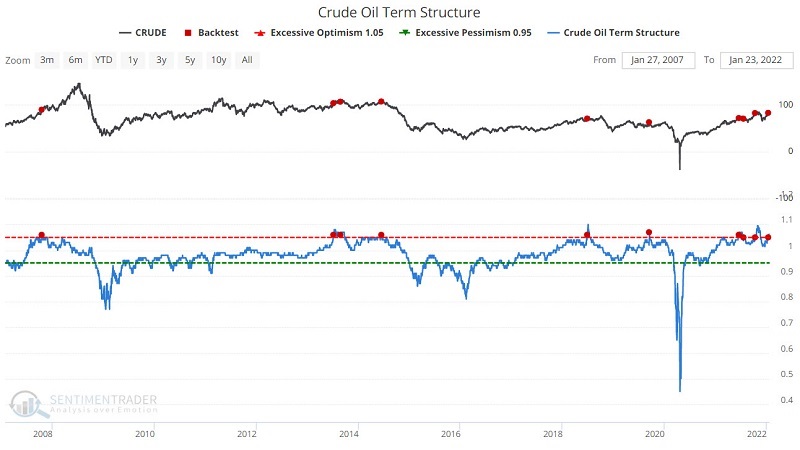
The table below displays the summary of crude oil performance following previous signals. Crude tended to show weakness 1, 2, 6, and 12 months after previous signals.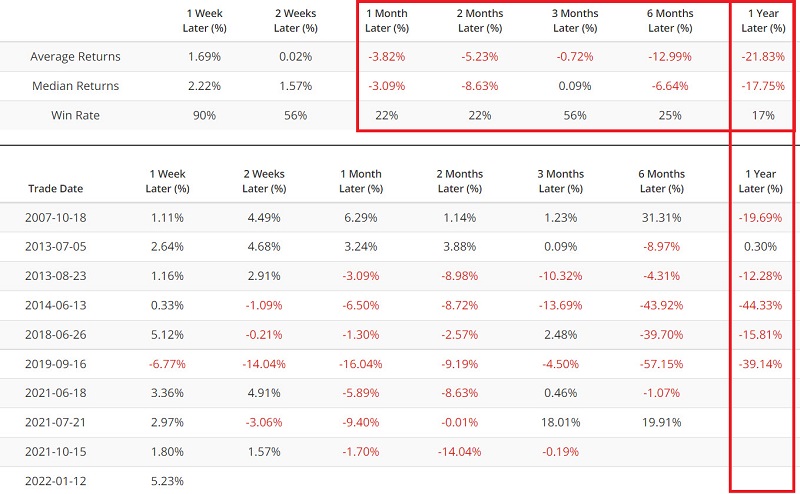
Energy stocks breadth
Now let's turn our attention to the relationship between crude oil and energy stocks. The chart below displays those times when the 10-day average of the % of XLE component stocks above their 200-day moving average reached 100%, while crude oil was above its 50-day average.
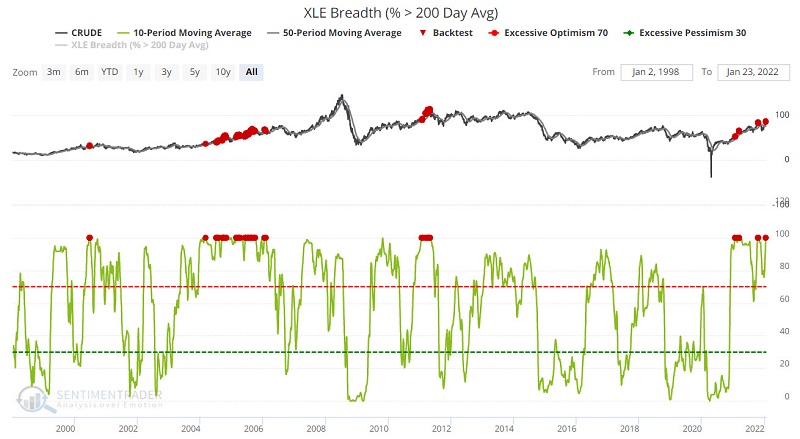
The table below shows that crude oil has demonstrated a tendency to show weakness one and 2-months after a signal.
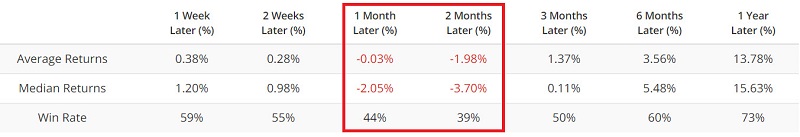
The most recent signals occurred on 1/20/2022 and 1/21/2022.
What the research tells us...
It is hard to find anything that has been more steadfastly bullish in the past 20 months than crude oil. But while it is important to respect powerful trends, it is also necessary to trading success to realize that no trend will last forever. We cannot say if the warning signs highlighted here will mark a meaningful turning point for crude oil or not. However, we do suspect that the sailing for crude oil will not be nearly as smooth in the months ahead as it has been up until now.