Products
SentimenTrader Trading Tools
‍
Backtest Engine
My Trading Toolkit
Correlation Analysis
Seasonality
Market Prediction
Indicators & Data API
‍
Proprietary Indicators & Charts
Market Data API
Strategies & Scanner
‍
50+ Trading Strategies
Smart Stock Scanner
Smart Option Scanner
Research Reports
‍
Research Solutions
Reports Library
Free Resources
Simple Backtest Calculator
Simple Seasonality Calculator
The Kelly Criterion Calculator
Sentiment Geo Map
Public Research Reports
Education
Sentiment Indicators
Technical Indicators
Pricing
Company
About
In the News
Testimonials
Client Success Stories
Contact
Log inLoginSign up
< BACK TO ALL REPORTS

It's time to keep an eye on corn

Jay Kaeppel
2025-06-16
Corn is soon entering its weakest seasonal period of the year. After trying to rally, corn has again dipped into a price decline. As long as seasonality and price action agree, aggressive traders can soon look for an opportunity to play the short side of this highly cyclical market.

Key points

  • Corn prices declined roughly 50% from April 2022 into August 2024
  • Price then rallied almost 40% into February 2025, but has been trending lower ever since
  • This price weakness, combined with the impending weakest seasonal period of the year, suggests that traders focus on the short side of corn

Corn price action displays weakness

The price of corn has declined significantly in recent years. The chart below displays a weekly chart of corn futures with a 40-week moving average. 

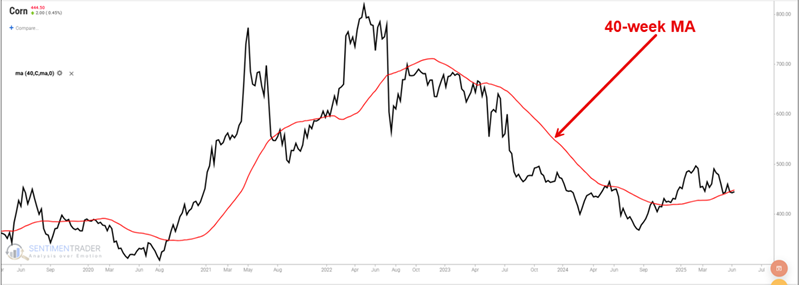
The good news is that price worked back above its long-term moving average early in 2025. The bad news is that it recently dipped back below this long-term average.

For a slightly different perspective, the chart below displays a daily chart of corn futures with a 70-day exponential moving average. By this measure, it can be strongly argued that corn is back in an established downtrend in price.

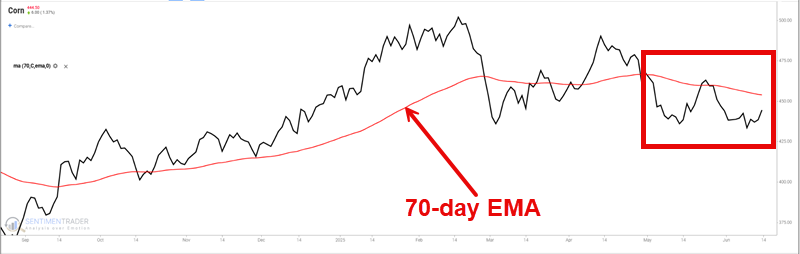
Why does this matter? Because corn is about to enter its weakest seasonal period of the year (more in a moment). The best seasonal trading opportunities tend to occur when seasonality and price action agree.

Corn is entering a most unfavorable seasonal window

As always, an annual seasonal chart is simply an average of what has happened in the past and is NOT a roadmap to what will happen this time. That said, note in the annual seasonal chart below that corn futures are entering a period of seasonal weakness that extends from the close of trading day of the year (TDY) #115 through TDY #155. For 2025, this period extends from the close on 2025-06-17 through 2025-08-14.

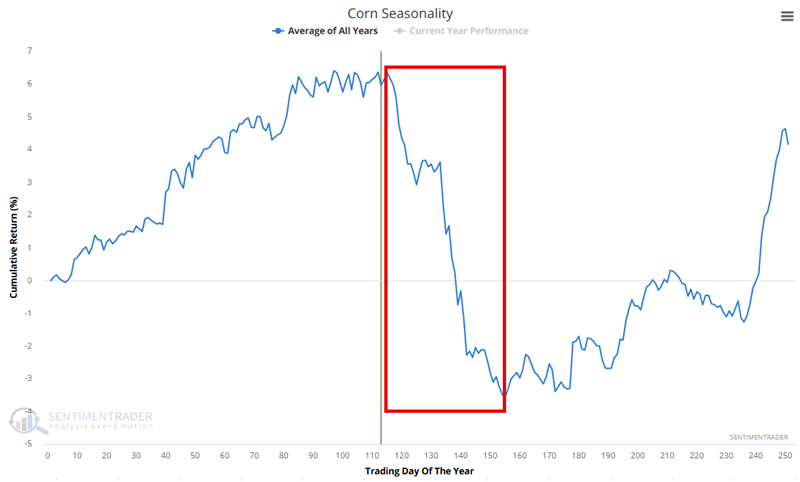
An important thing to remember about seasonality: The plunge shown in the red box in the chart above does not guarantee a significant decline for corn futures in the months ahead. In fact, corn could rally significantly during this period in 2025. However, trading is a game of odds. The chart above tells us that the odds favor the bears in the months ahead, especially in the face of a weak price trend. In the reality of trading, each individual trader is still responsible for managing risk in case things go "the other way", no matter how "perfect" the setup may appear to be.

Each one whole point of movement in the price of corn futures is worth $50. The chart below displays the hypothetical cumulative $ +(-) achieved by holding a long position in corn futures during the TDY #115 through #155 period since 1976.

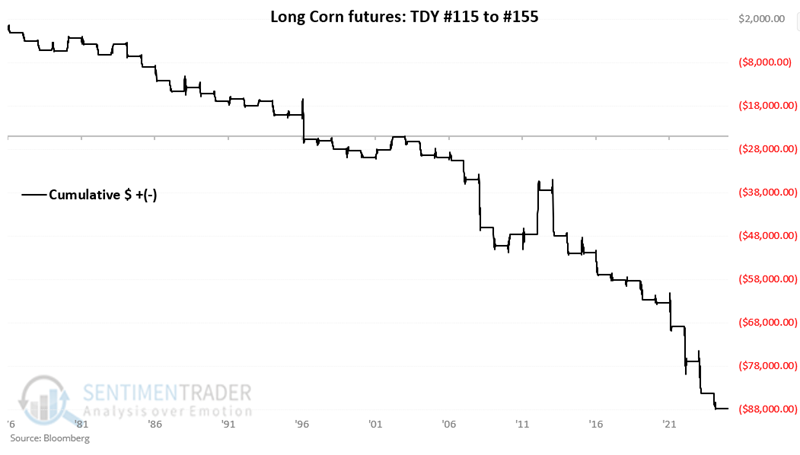
The table below summarizes corn futures performance during this period.

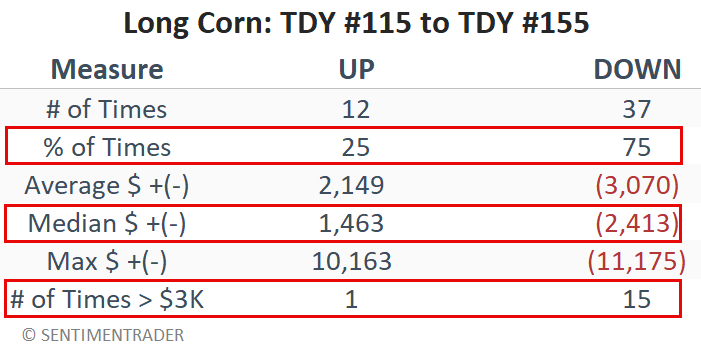
A 25% Win Rate tells us that corn has declined three out of every four years during this period. Probably the key thing to note is that there have been 15 declines of $3,000 or more during this period, but only one gain of $3,000 or more. While there are no guarantees from year to year, this clearly suggests a serious tendency for weakness.

What the research tells us…

Regarding seasonality in the financial markets, the caveat is always the same: No seasonal trend is guaranteed to play out as it has tended to in the past. That said, corn has a long history of exhibiting significant price weakness between mid-June and mid-August. Traders who insist on playing the long side of corn might seriously consider a trailing stop. On the other hand, aggressive futures traders should be looking for an opportunity to trade the short side of corn.

PRODUCTS
SentimenTrader
Trading Tools
Indicators & Data API
‍
Strategies & Scanner
‍
Research Reports
FREE
RESOUrCES
Simple Backtest
Calculator
Simple Seasonality
Calculator
The Kelly Criterion
Calculator
Sentiment Geo Map
‍
Public Research Reports
‍
Education
Sentiment Indicators
‍
Technical Indicators
‍
Pricing
Bundle pricing
‍
FAQ
‍
Announcements
‍
COMPANY
‍
About
‍
In the News
‍
Testimonials
‍
Client Success Stories
CONTACT
‍
General Inquiries
‍
Media Inquiries
‍
Financial Professionals Inquiries
‍
© 2026 Sundial Capital Research Inc. All rights reserved.
Setsail Marketing
TermsPrivacyAffiliate Program
Risk Disclosure: The information and tools provided are for research and analytical purposes only and are not intended as investment advice. Market analysis involves uncertainty, and outcomes may differ from expectations. Users should conduct their own due diligence and consider their individual circumstances before making any financial decisions. Past performance is not necessarily indicative of future results.

Hypothetical Performance Disclosure: Hypothetical performance results have many inherent limitations, some of which are described below. No representation is being made that any account will or is likely to achieve profits or losses similar to those shown; in fact, there are frequently sharp differences between hypothetical performance results and the actual results subsequently achieved by any particular trading program. One of the limitations of hypothetical performance results is that they are generally prepared with the benefit of hindsight. In addition, hypothetical trading does not involve financial risk, and no hypothetical trading record can completely account for the impact of financial risk of actual trading. for example, the ability to withstand losses or to adhere to a particular trading program in spite of trading losses are material points which can also adversely affect actual trading results. There are numerous other factors related to the markets in general or to the implementation of any specific trading program which cannot be fully accounted for in the preparation of hypothetical performance results and all which can adversely affect trading results.

Testimonial Disclosure: Testimonials appearing on this website may not be representative of other clients or customers and is not a guarantee of future performance or success.