Products
SentimenTrader Trading Tools
‍
Backtest Engine
My Trading Toolkit
Correlation Analysis
Seasonality
Market Prediction
Indicators & Data API
‍
Proprietary Indicators & Charts
Market Data API
Strategies & Scanner
‍
50+ Trading Strategies
Smart Stock Scanner
Smart Option Scanner
Research Reports
‍
Research Solutions
Reports Library
Free Resources
Simple Backtest Calculator
Simple Seasonality Calculator
The Kelly Criterion Calculator
Sentiment Geo Map
Public Research Reports
Education
Sentiment Indicators
Technical Indicators
Pricing
Company
About
In the News
Testimonials
Client Success Stories
Contact
Log inLoginSign up
< BACK TO ALL REPORTS

It's time to keep an eye on corn

Jay Kaeppel
2024-06-13
After absorbing a beating into early February, corn futures have been climbing. History strongly suggests that the rally will not last and that traders eschew the long side of corn and look for an opportunity to play the short side.

Key points

  • Corn bottomed in February 2024 and has been trending higher since
  • The good news is that price action is favorable above a newly rising 70-day moving average
  • The bad news is that corn is soon to enter its most challenging time of year, and if history holds, traders should be looking for an opportunity to play the short side

After a rough start to 2024, corn has worked slightly higher

The chart below shows that corn futures fell hard into late February. Since then, price has been working its way higher and presently sits above a rising 70-day moving average.

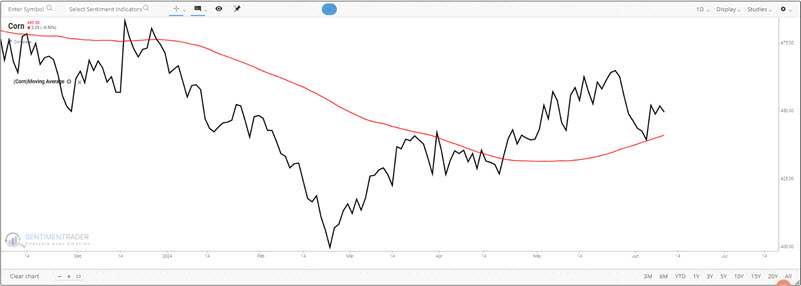
Based on this interpretation, it is reasonable to argue that corn is in an "established uptrend." But as always, it depends on how you look at things. The chart below shows that corn presently remains below its long-term 200-day moving average.

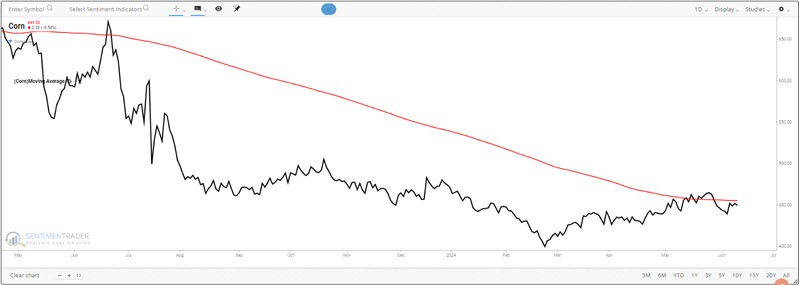
So, is corn in an uptrend or a downtrend? To some extent, that is in the eye of the beholder. Regardless of how one sees the trend, there is reason for caution on the long side in the months ahead.

Corn is entering a most unfavorable seasonal window

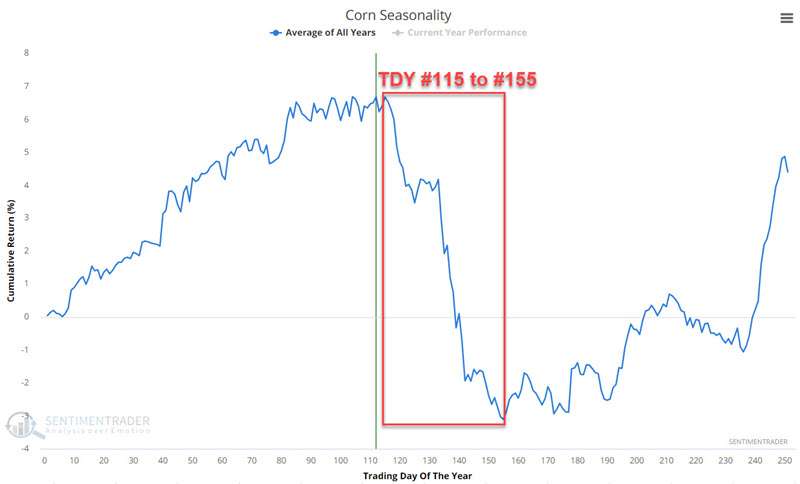
As always, an annual seasonal chart is simply an average of what has happened in the past and is NOT a roadmap to what will happen this time. That said, note in the annual seasonal chart below that corn futures are entering a period of seasonal weakness that extends from the close of trading day of the year (TDY) #115 through TDY #155. 

For 2024, this period extends from the close on 2024-06-14 through 2024-08-13.

How challenging has this period been? The chart below displays the hypothetical cumulative $ +(-) achieved by holding a long position in corn futures during the TDY #115 through #155 period since 1974.

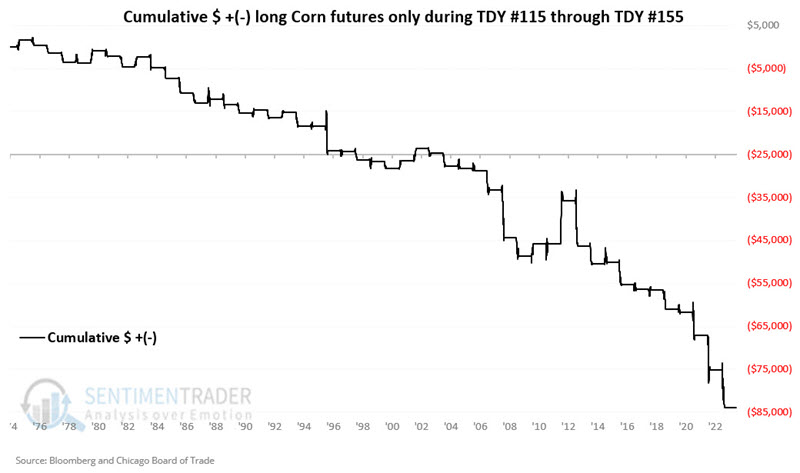
The table below summarizes corn futures performance during this period.

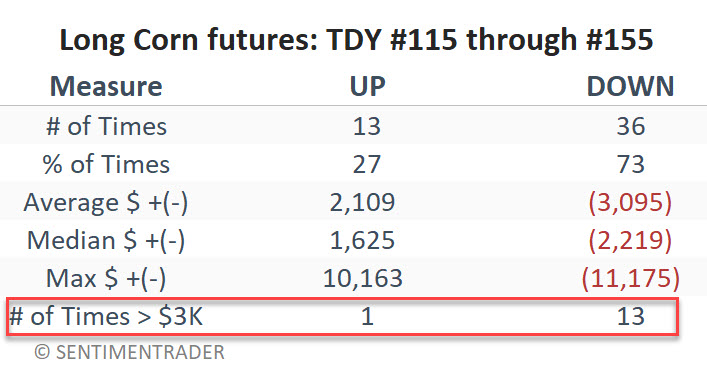
A 27% Win Rate reminds us that a price decline during this period is no sure thing. Nevertheless, the overall results skew heavily negative. Note that if we look solely at periods that saw a move of $3,000 or more in contract value, only one showed a gain, and thirteen witnessed a loss. This clearly indicates that traders should favor the short side for corn during this period.

What the research tells us…

No seasonal trend is guaranteed to play out as it has tended to in the past. That said, corn has a long history of exhibiting significant price weakness between mid-June and mid-August. Traders who insist on playing the long side of corn might seriously consider a trailing stop. On the other hand, aggressive futures traders should be looking for an opportunity to trade the short side of corn. 

PRODUCTS
SentimenTrader
Trading Tools
Indicators & Data API
‍
Strategies & Scanner
‍
Research Reports
FREE
RESOUrCES
Simple Backtest
Calculator
Simple Seasonality
Calculator
The Kelly Criterion
Calculator
Sentiment Geo Map
‍
Public Research Reports
‍
Education
Sentiment Indicators
‍
Technical Indicators
‍
Pricing
Bundle pricing
‍
FAQ
‍
Announcements
‍
COMPANY
‍
About
‍
In the News
‍
Testimonials
‍
Client Success Stories
CONTACT
‍
General Inquiries
‍
Media Inquiries
‍
Financial Professionals Inquiries
‍
© 2026 Sundial Capital Research Inc. All rights reserved.
Setsail Marketing
TermsPrivacyAffiliate Program
Risk Disclosure: The information and tools provided are for research and analytical purposes only and are not intended as investment advice. Market analysis involves uncertainty, and outcomes may differ from expectations. Users should conduct their own due diligence and consider their individual circumstances before making any financial decisions. Past performance is not necessarily indicative of future results.

Hypothetical Performance Disclosure: Hypothetical performance results have many inherent limitations, some of which are described below. No representation is being made that any account will or is likely to achieve profits or losses similar to those shown; in fact, there are frequently sharp differences between hypothetical performance results and the actual results subsequently achieved by any particular trading program. One of the limitations of hypothetical performance results is that they are generally prepared with the benefit of hindsight. In addition, hypothetical trading does not involve financial risk, and no hypothetical trading record can completely account for the impact of financial risk of actual trading. for example, the ability to withstand losses or to adhere to a particular trading program in spite of trading losses are material points which can also adversely affect actual trading results. There are numerous other factors related to the markets in general or to the implementation of any specific trading program which cannot be fully accounted for in the preparation of hypothetical performance results and all which can adversely affect trading results.

Testimonial Disclosure: Testimonials appearing on this website may not be representative of other clients or customers and is not a guarantee of future performance or success.