
It's time to keep an eye on copper (and a copper miner ETF)

Key points
- The Copper/Gold Ratio recently crossed a threshold that has tended to portend good things for the price of copper in the year ahead
- A seasonal tailwind might help copper between now and March 2024
- Investors can trade copper futures, copper ETFs, or individual copper mining stocks
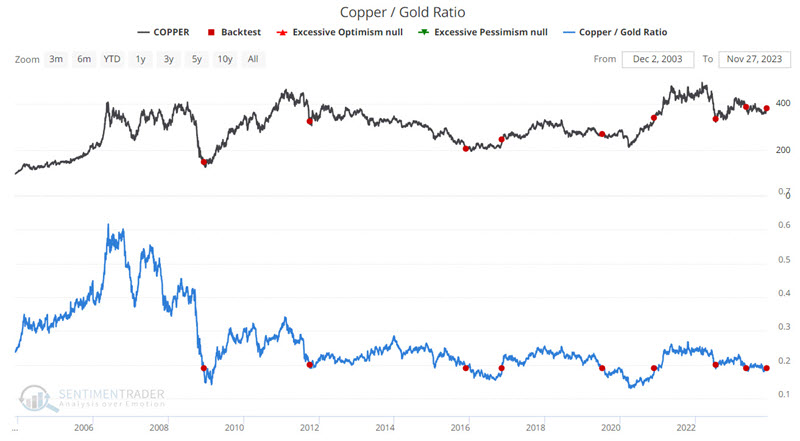
The Copper/Gold Ratio crosses a significant level
As the name implies, the Copper/Gold Ratio compares the price of copper futures to the price of gold futures to essentially measure the relationship between the foremost industrial and precious metals.
The chart below highlights those dates when the Copper/Gold Ratio crossed above 0.19 for the first time in at least six months. The most recent signal occurred on 2023-11-20.
The table below displays the performance for copper futures following the signals shown in the chart above.
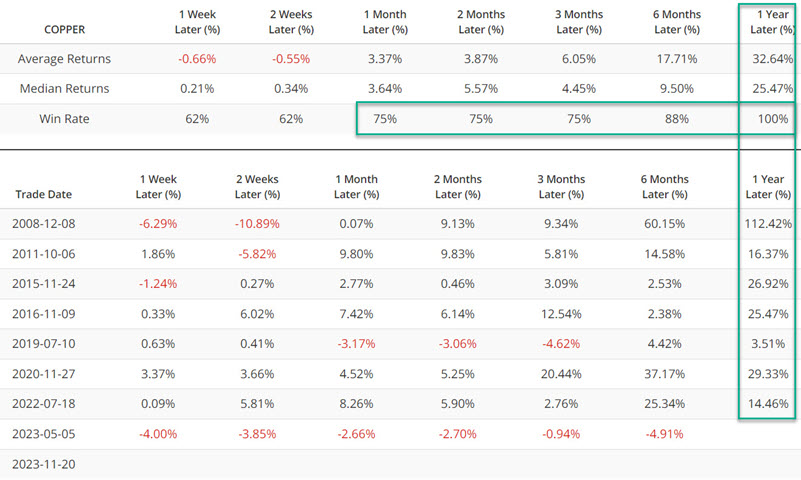
This is a relatively small sample size; however, the persistence of the Win Rate for six months and 1-year is noteworthy. Likewise, in six of seven instances, 1-year returns have been +14.46% or higher. This does not guarantee that a significant gain is in the offing between now and late November 2024. But it does suggest that traders consider giving the bullish case for copper the benefit of the doubt.
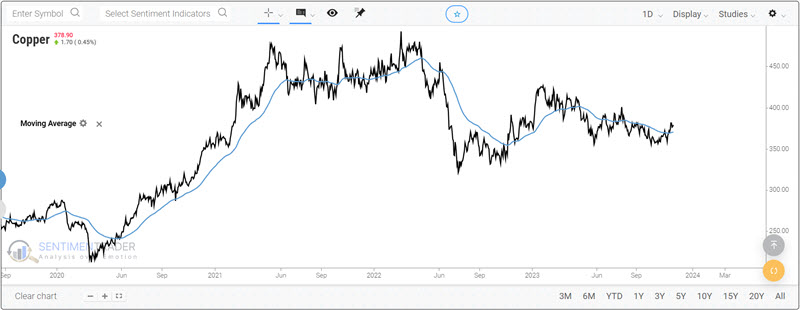
On a trend-following note, copper futures recently popped back above their 75-day exponential moving average. As you can see clearly in the chart below, this in no way guarantees anything, as copper futures have chopped back and forth above and below this indicator many times in the last several years. Nevertheless, the longer that price holds above this average, the greater the odds of a meaningful move to the upside.
A potentially favorable seasonal tailwind
The chart below displays the annual seasonal trend for copper futures. The current period between now and the Trading Day of Year #47 next year is highlighted in green.
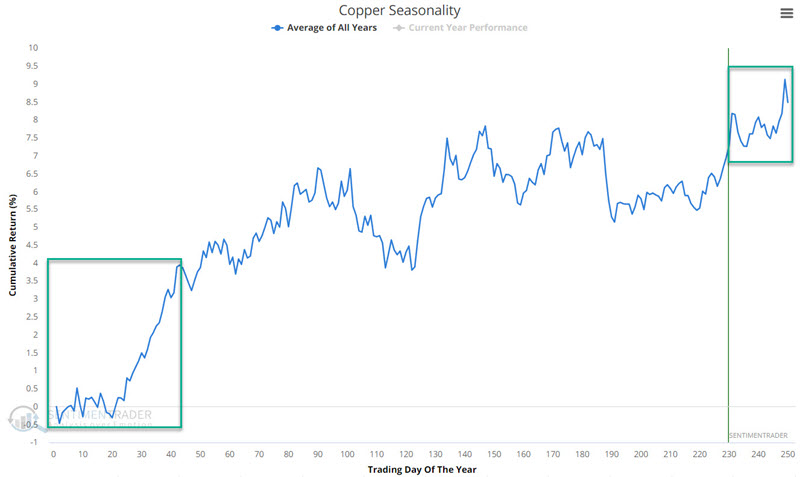
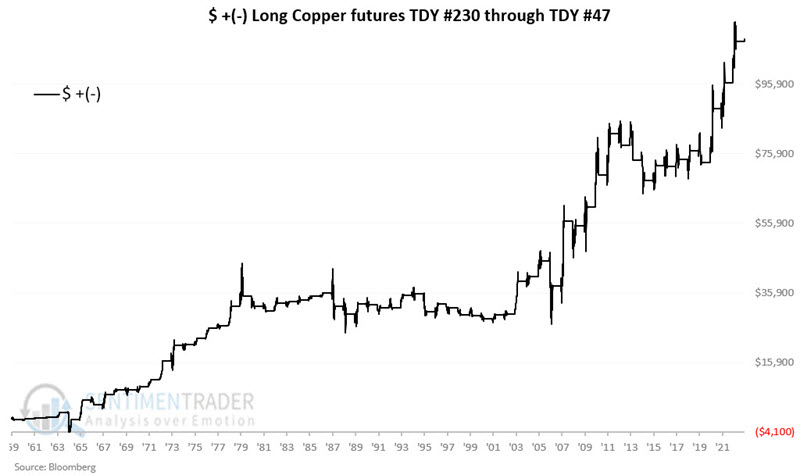
The chart below displays the cumulative $ gain/loss from holding a long position in copper futures only during this period since 1959.
The table below summarizes copper futures' performance during this period.
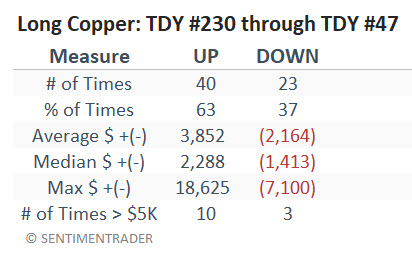
A 63% Win Rate suggests that this factor should not be relied upon as a standalone indicator. However, when combined with a more meaningful signal - such as the one from the Copper/Gold Ratio - and if also confirmed by an uptrend in price, this seasonal trend can add significant weight to the bullish side of the ledger. Large moves over $5,000 have historically skewed 10 to 3 to the winning side.
Alternatives to Copper futures
Most investors and traders will never trade copper futures due to the leverage and volatility involved. That does not mean they cannot gain exposure to copper as an asset class. There are several possibilities.
The United States Copper Index Fund, LP (ticker CPER) is an ETF that invests in copper futures contracts. The ETF's objective is to reflect the return of an index benchmark for copper futures minus its expenses. The ETF's holdings include copper futures contracts and an equal amount of cash and equivalents serving as collateral. In essence, investors can buy access to the price movements of copper just as they would by buying shares of stocks.
Another alternative would be to take a long position in copper mining companies via an ETF or shares of individual companies. The Global X Copper Miners ETF (ticker COPX) invests at least 80% of its total assets in the securities of the underlying index and in American Depositary Receipts ("ADRs") and Global Depositary Receipts ("GDRs") based on the securities in the underlying index. The underlying index measures the broad-based equity market performance of global companies involved in the copper mining industry.
Generally speaking, CPER and COPX trade with about an 80% correlation, so results will typically be similar in terms of trend. However, there can be wide discrepancies in terms of total return. Investors are encouraged to do their due diligence before investing in copper mining stocks based on the above signals.
A closer look at Copper Miners (COPX) versus Copper (CPER)
Why bother looking at copper miners? Because they tend to outperform during bullish periods for copper. So, if the hoped-for rally in copper does materialize in the months ahead, history suggests that copper miners will outperform the metal itself.
The caveat is that they also tend to underperform during bearish periods for copper - so if the hoped-for rally in copper fails to materialize, copper miners are likely to suffer more than the metal itself.
The chart below highlights the highs and lows for ticker CPER since its inception and the ratio between ticker COPX (miners) and CPER (copper index).
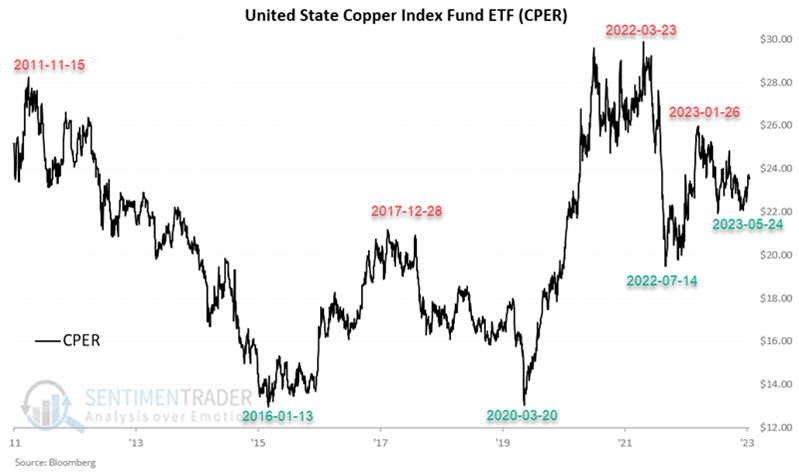
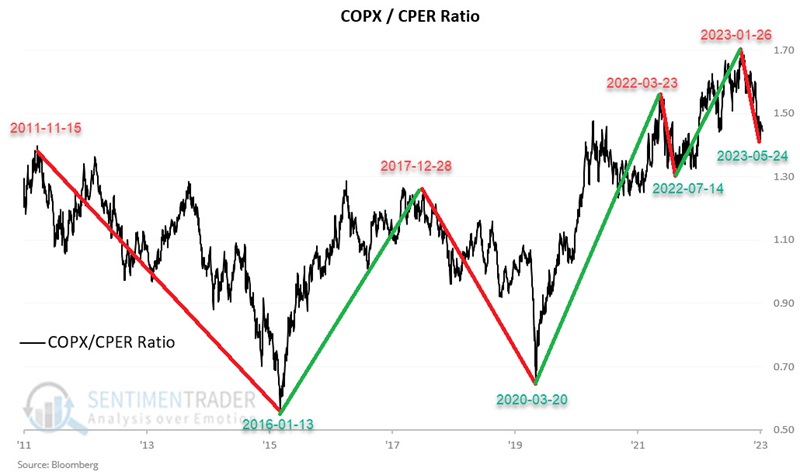
During bullish periods for copper (the metal itself), copper miners tended to outperform significantly - and vice versa.
The table below highlights COPX, CPER, and the ratio between the two performances during bullish periods for CPER. Note that COPX has, on average, outperformed CPER by a factor of 2.9-to-1 during bullish periods for CPER.
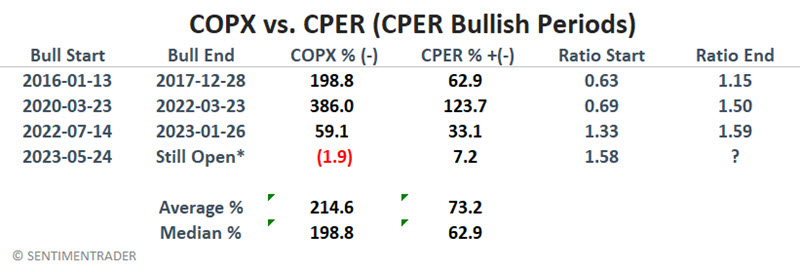
Three caveats: The CPER highs and lows are selected with the benefit of hindsight; there is no guarantee that the May 2023 low will hold or that CPER is destined to rise from here. Since the 2023-05-24 low for CPER, COPX has lost -1.9% while CPER has gained +7.2% - i.e., so far, not so good.
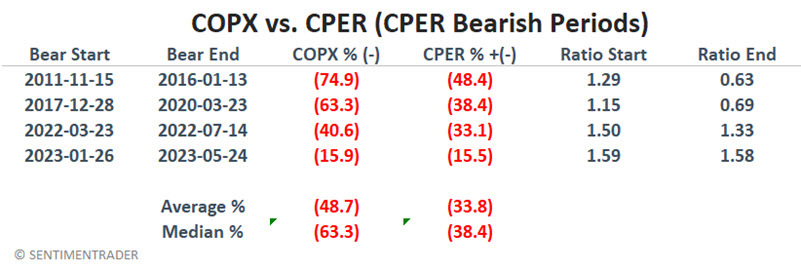
For comparison, the table below highlights COPX, CPER, and the ratio between the two performances during bearish periods for CPER. Note that COPX has, on average, underperformed CPER by a factor of 1.44-to-1.
The bottom line: Copper miners tend to move more than copper, both to the upside and the downside. If a trader expects an advance in the price of copper, there may be an advantage in holding a long position in copper miners instead. Likewise, if a trader is bearish on copper, copper miners should likely be avoided altogether (or played from the short side for those inclined).
The caveat is that if a trader is bullish on copper and copper declines instead, losses will likely be greater for a trader holding a long position in copper miners.
What the research tells us…
The research tells us that now is a time for investors willing to speculate in metals to keep a close eye on the copper market. The signals from the Copper/Gold Ratio and Copper Seasonality both suggest a favorable trend - and in the past, the accompanying trends have often been significantly bullish. But as always, there are no guarantees on each particular roll of the dice. Investors should also carefully consider the best trading vehicle to use (futures, ETFs, or individual copper-related stocks), how much capital to commit, and how much to risk.