Products
SentimenTrader Trading Tools
‍
Backtest Engine
My Trading Toolkit
Correlation Analysis
Seasonality
Market Prediction
Indicators & Data API
‍
Proprietary Indicators & Charts
Market Data API
Strategies & Scanner
‍
50+ Trading Strategies
Smart Stock Scanner
Smart Option Scanner
Research Reports
‍
Research Solutions
Reports Library
Free Resources
Simple Backtest Calculator
Simple Seasonality Calculator
The Kelly Criterion Calculator
Sentiment Geo Map
Public Research Reports
Education
Sentiment Indicators
Technical Indicators
Pricing
Company
About
In the News
Testimonials
Client Success Stories
Contact
Log inLoginSign up
< BACK TO ALL REPORTS

Its time to keep an eye on copper

Jay Kaeppel
2023-04-25
Copper rallied strongly from September 2022 into January of this year. Since then, it has been in a trading range and, most recently, is falling hard. This critical industrial metal is about to enter a highly unfavorable time of year. This piece details the history and what it means for traders as May approaches.

Key points

  • Copper will soon enter one of the most seasonally unfavorable parts of the year
  • While year-to-year results can vary greatly, the long-term trend has been unmistakably bearish
  • May has historically been the weakest month of the year for copper

Copper is soon entering a seasonally unfavorable period

Copper has shown a historical tendency for price weakness between Trading Day of the Year (TDY) #82 and TDY #123. In 2023, this period extends from the close on 2023-04-27 through the close on 2023-06-23. The red box highlights this period in the annual seasonal chart shown below.

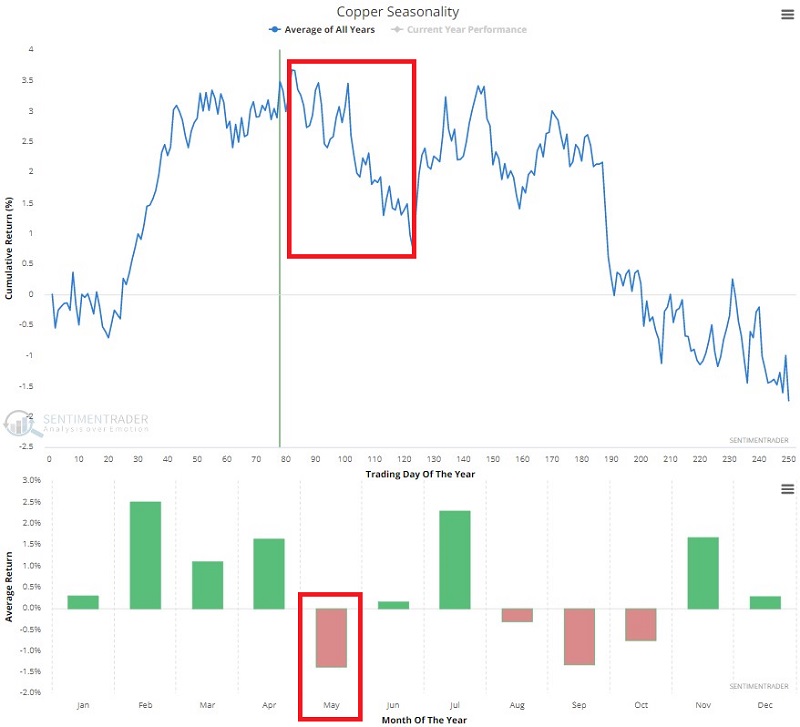
Note also that May has historically been the worst month of the year for copper.

A closer look at copper in late spring

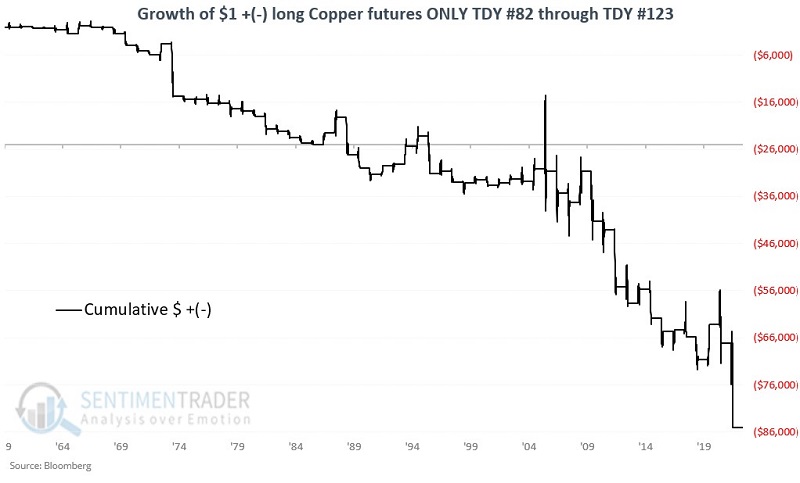
The chart below displays the hypothetical $ +(-) achieved by holding one copper futures contract only during the TDY #82 through TDY #123 period, every year starting in 1960 (copper futures contracts began trading in 1988. Before that time, cash copper prices are used for testing purposes).

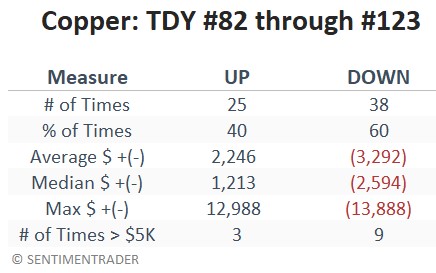
The table below summarizes performance during TDY #82 through TDY #123. 

The two key things to note are:

  • There is no guarantee that copper will decline during this period in any given year
  • The long-term tendency for weakness is unmistakable

CPER as an ETF alternative

The United States Copper Index Fund ETF (ticker CPER) is designed to be a convenient, cost-effective way for investors to access the returns of a portfolio of copper futures contracts. As such, it also has tended to show weakness during the seasonally unfavorable period highlighted above.

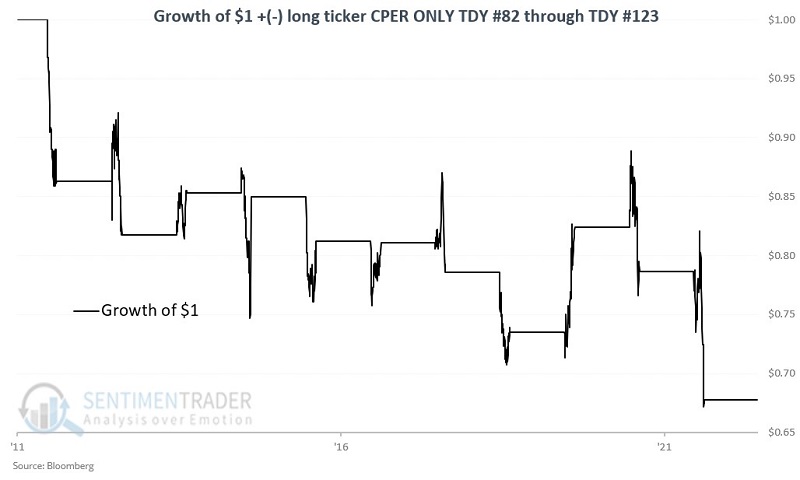
The chart below displays the hypothetical growth of $1 achieved by holding long ticker CPER only during the TDY #82 through TDY #123 period, every year starting in 2011 (when CPER began trading).

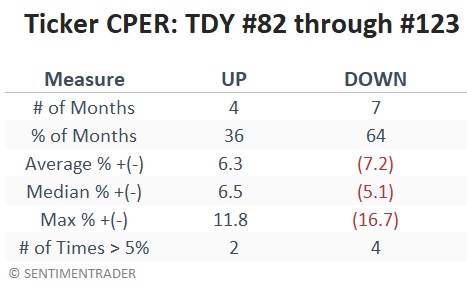
The table below summarizes CPER performance during TDY #82 through TDY #123. 

What the research tells us…

The caveat with seasonality is always the same: There is never any guarantee that a given seasonal trend will play out as expected each time around. There is no reason copper futures (and ticker CPER) cannot rally over the next month or so. But the real issue for traders to ponder is "how best to allocate capital." If one has a solid reason to believe that copper will rally soon, then a long position (preferably with a reasonable stop-loss point) can make sense. Under any other circumstance, history suggests that the long side of copper is best avoided. Traders who are so inclined - and capable of understanding and managing the risks involved - may consider playing the short side of copper during this seasonally unfavorable period.

PRODUCTS
SentimenTrader
Trading Tools
Indicators & Data API
‍
Strategies & Scanner
‍
Research Reports
FREE
RESOUrCES
Simple Backtest
Calculator
Simple Seasonality
Calculator
The Kelly Criterion
Calculator
Sentiment Geo Map
‍
Public Research Reports
‍
Education
Sentiment Indicators
‍
Technical Indicators
‍
Pricing
Bundle pricing
‍
FAQ
‍
Announcements
‍
COMPANY
‍
About
‍
In the News
‍
Testimonials
‍
Client Success Stories
CONTACT
‍
General Inquiries
‍
Media Inquiries
‍
Financial Professionals Inquiries
‍
© 2026 Sundial Capital Research Inc. All rights reserved.
Setsail Marketing
TermsPrivacyAffiliate Program
Risk Disclosure: The information and tools provided are for research and analytical purposes only and are not intended as investment advice. Market analysis involves uncertainty, and outcomes may differ from expectations. Users should conduct their own due diligence and consider their individual circumstances before making any financial decisions. Past performance is not necessarily indicative of future results.

Hypothetical Performance Disclosure: Hypothetical performance results have many inherent limitations, some of which are described below. No representation is being made that any account will or is likely to achieve profits or losses similar to those shown; in fact, there are frequently sharp differences between hypothetical performance results and the actual results subsequently achieved by any particular trading program. One of the limitations of hypothetical performance results is that they are generally prepared with the benefit of hindsight. In addition, hypothetical trading does not involve financial risk, and no hypothetical trading record can completely account for the impact of financial risk of actual trading. for example, the ability to withstand losses or to adhere to a particular trading program in spite of trading losses are material points which can also adversely affect actual trading results. There are numerous other factors related to the markets in general or to the implementation of any specific trading program which cannot be fully accounted for in the preparation of hypothetical performance results and all which can adversely affect trading results.

Testimonial Disclosure: Testimonials appearing on this website may not be representative of other clients or customers and is not a guarantee of future performance or success.