
Its time to keep an eye on biotech and metals and mining

Key points
- I have been focusing quite a bit on seasonality recently, as many sectors tend to experience weakness during September into October
- The biotech and metals and mining sectors are nearing a period of potential seasonal weakness with well-established overhead resistance levels overhead
- One caveat is that it can be dangerous to sell short into strength - but it pays to be prepared in case the market reverses lower
Biotech nears resistance at a critical time
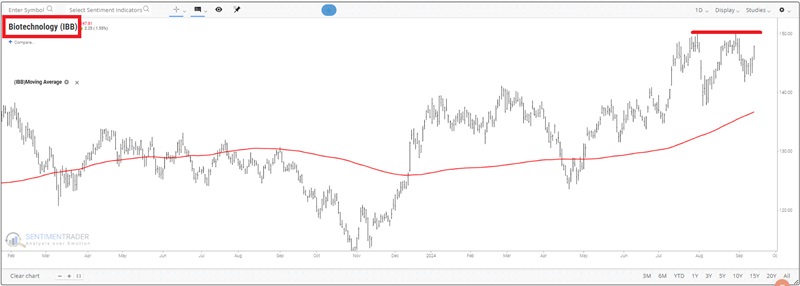
The biotech sector has flown under the radar for much of the last year. The chart below reveals that the iShares Biotechnology ETF (ticker IBB) has advanced +32% since November 2023 and almost +20% since making a higher low in April 2024.
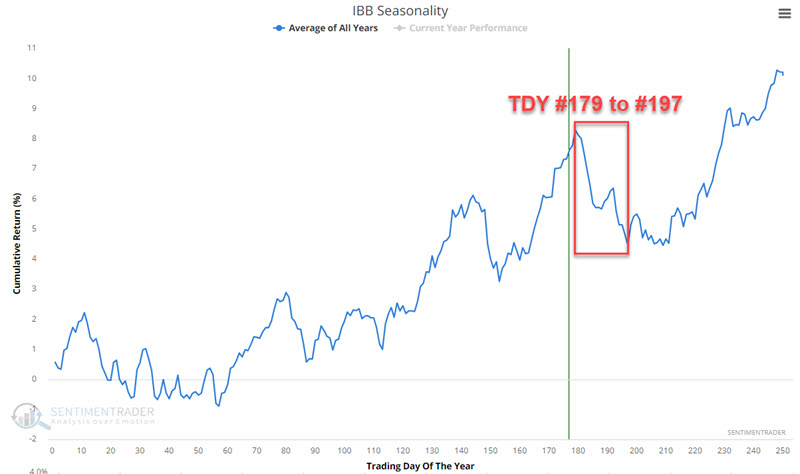
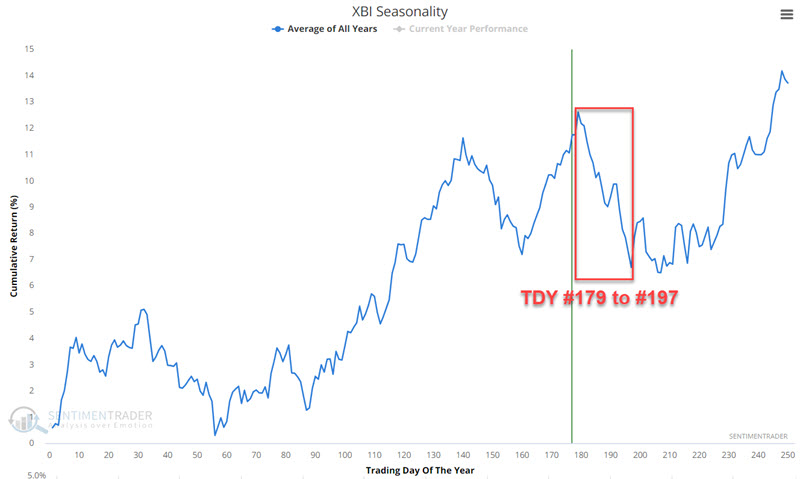
The chart below displays the annual seasonal trend for IBB. Note that an unfavorable period extends from Trading Day of Year (TDY) # 179 through TDY #197. For 2024, that period extends from the close on 2024-09-17 through 2024-10-11.
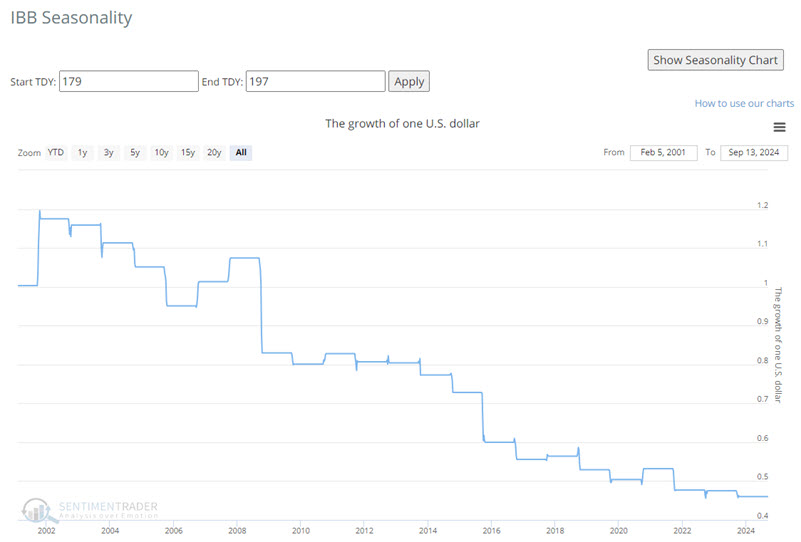
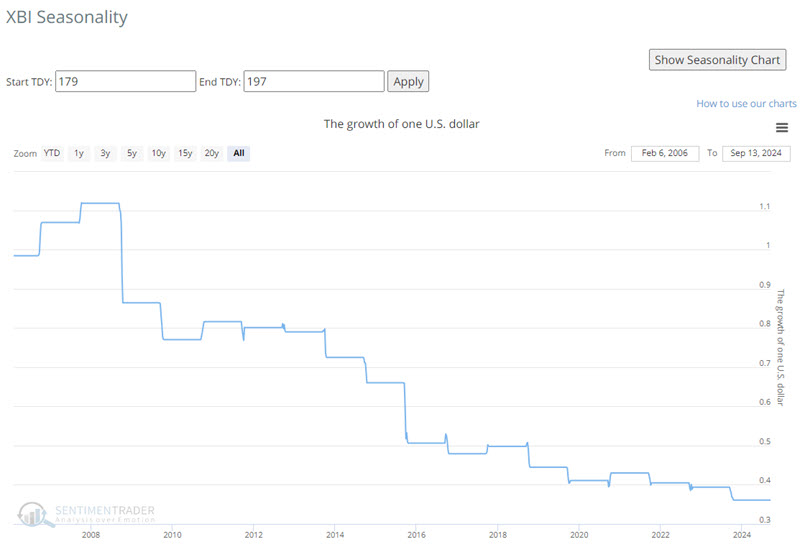
The chart below displays the hypothetical cumulative $ +(-) achieved by holding a long position in IBB only during the TDY #179 to #197 period since 2002.
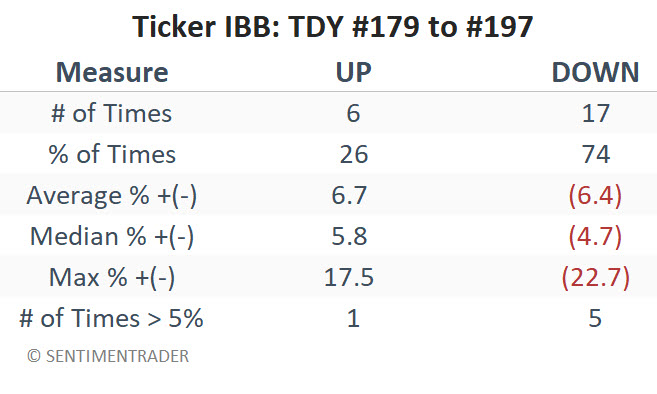
The table below summarizes IBB's performance during this period.
Another biotech ETF to consider is the SPDR S&P Biotech ETF (ticker XBI). It has a shorter but similar history.
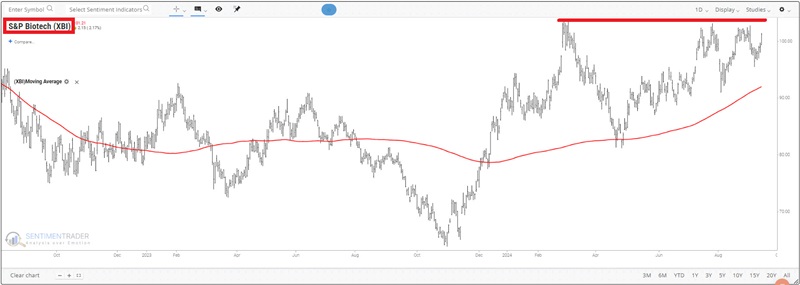
For aggressive traders considering playing the short side of the biotech sector, one key thing to note is that options trading volume on ticker XBI is significantly higher than on IBB. Recently, XBI has traded over 50,000 puts in a day (and over 100K calls and puts combined) versus roughly 3,000 puts per day and roughly 5K calls and puts for IBB.
As this seasonally unfavorable period approaches, let's remind ourselves that seasonal trends are most useful when price trends and seasonal trends are at least somewhat in alignment. That is presently not the case for biotech, as IBB and XBI have been trending higher. That said, both do have a "line in the sand" resistance level overhead. Aggressive short-term traders who might consider playing the short side should keep a close eye on the red resistance line drawn on the price chart above. A move above that level would act as a warning sign to bearish traders.
The Metals and Mining sector is a laggard
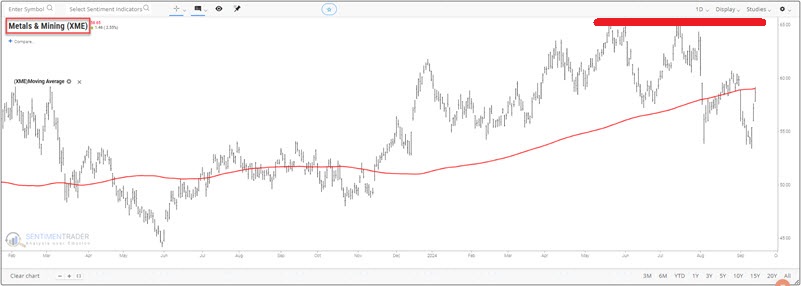
With gold and silver soaring of late, one might be surprised to learn that the metals and mining sector is lagging the market badly. In the chart below, we see that the SPDR S&P Metals & Mining ETF (ticker XME) is presently trading below its 200-day moving average and has a meaningful resistance level overhead.
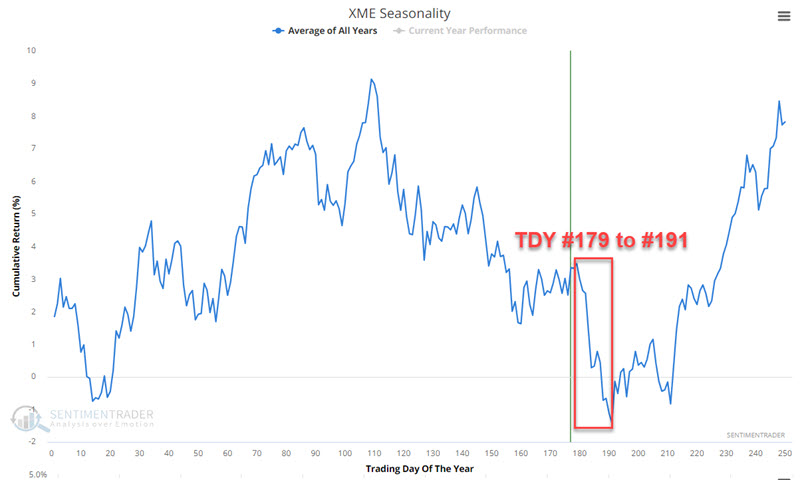
The chart below displays the annual seasonal trend for XME. Note that an unfavorable period extends from Trading Day of Year (TDY) # 179 through TDY #191. For 2024, that period extends from the close on 2024-09-17 through 2024-10-03.
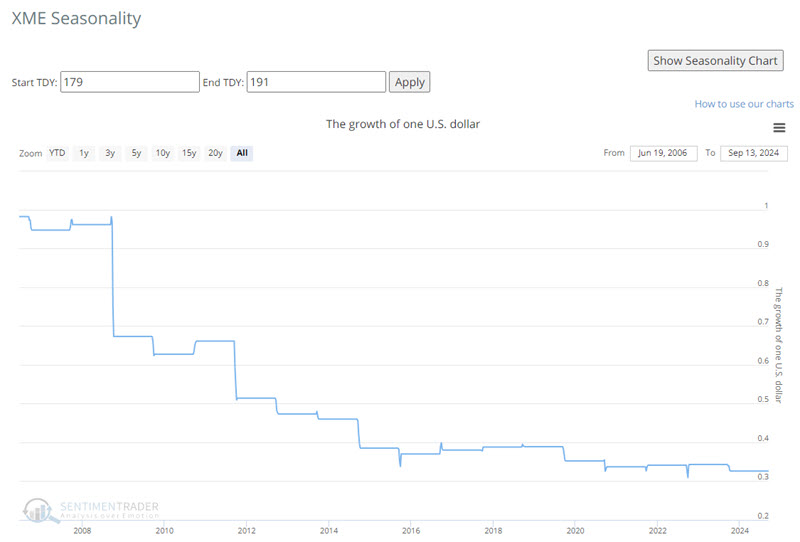
The chart below displays the hypothetical cumulative $ +(-) achieved by holding a long position in ticker XME only during the TDY #179 to #191 period since 2006.
The table below summarizes XME's performance during this period.
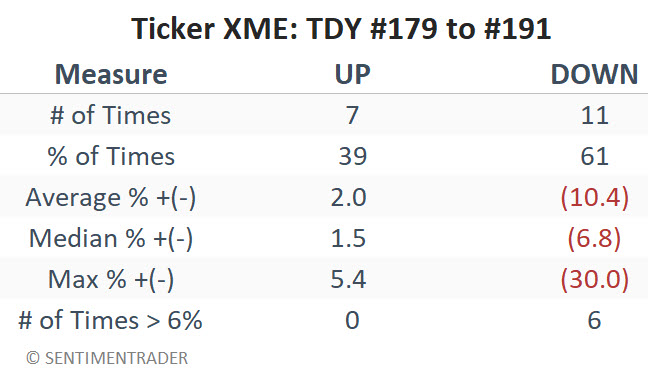
A Win Rate of 39% reminds us that the metals and mining sector is not doomed to decline in the weeks ahead. However, the other performance numbers in the table above remind us that upside tends to be limited (median gain of +1.5% and max. gain of +5.4%) while downside risk is concerning (median loss of -6.8% and max. loss of -30.0% - likewise six losses in excess of -6%). The fact that this sector is already experiencing some price weakness as this seasonally unfavorable period begins strongly suggests a potential opportunity.
What the research tells us…
From year to year, any given period that is supposedly "seasonally favorable" or "seasonally unfavorable" can fail to follow the pattern. Seasonality itself should not be thought of as a trading signal. Instead, it tells you "When to look where" for a potential opportunity. As long as the biotech and metals and mining sectors hold below their indicated resistance levels, aggressive traders can consider playing the short side (don't forget to consider options on XBI and XME in order to limit risk on a bearish play versus selling short ETF shares). Longer-term investors in these sectors might either consider hedging their position, raising some cash, or simply "girding their loins" for some potential volatility.