Products
SentimenTrader Trading Tools
‍
Backtest Engine
My Trading Toolkit
Correlation Analysis
Seasonality
Market Prediction
Indicators & Data API
‍
Proprietary Indicators & Charts
Market Data API
Strategies & Scanner
‍
50+ Trading Strategies
Smart Stock Scanner
Smart Option Scanner
Research Reports
‍
Research Solutions
Reports Library
Free Resources
Simple Backtest Calculator
Simple Seasonality Calculator
The Kelly Criterion Calculator
Sentiment Geo Map
Public Research Reports
Education
Sentiment Indicators
Technical Indicators
Pricing
Company
About
In the News
Testimonials
Client Success Stories
Contact
Log inLoginSign up
< BACK TO ALL REPORTS

It's time to keep an eye on biotech

Jay Kaeppel
2024-05-07
Traders should rarely rely on seasonality alone. However, when seasonal and price trends align, it is often an excellent time to look for trend-following opportunities. In this piece, we highlight the current setup in the biotech sector.

Key points

  • The iShares Biotechnology ETF (ticker IBB) just bounced off of an oversold level and moved back above its 200-day moving average
  • IBB is also entering its most favorable seasonal period of the year
  • This combination of factors does not guarantee a rally in the biotech sector; However, it does strongly suggest that traders be looking for an opportunity to play the long side in the months ahead

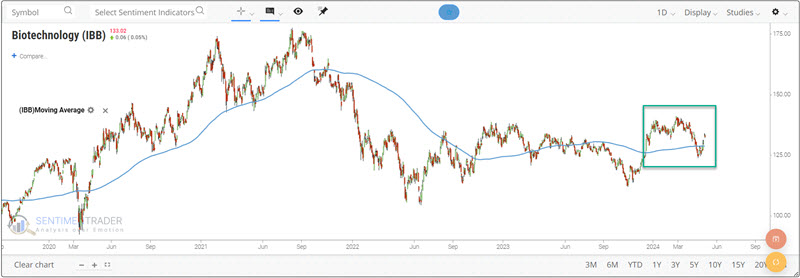
Biotech bounces, regains uptrend...for now

The chart below shows that IBB declined almost -12% in less than two months but has since rebounded strongly and crossed above its 200-day moving average. While we do not consider moving averages to be "predictive," they are helpful in objectively identifying the trend "right now." So technically, IBB is (for the moment) in an "uptrend."

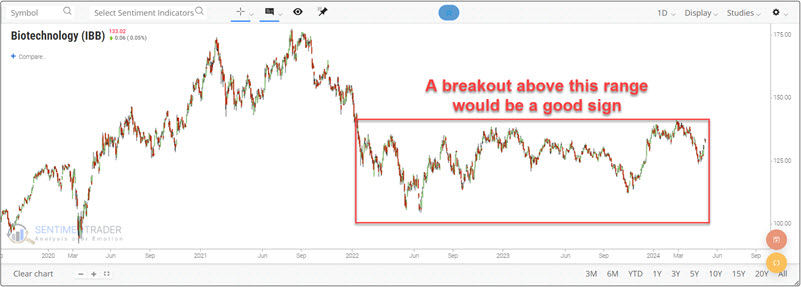
Further confirmation of an uptrend (for those looking for more) would occur if IBB can breakout above the top of the red box drawn in the chart below.

Biotech is entering a favorable seasonal period

As always, seasonality is "climate, not weather." That said, note that ticker IBB is entering its most favorable seasonal period of the year, as shown in the chart below. 

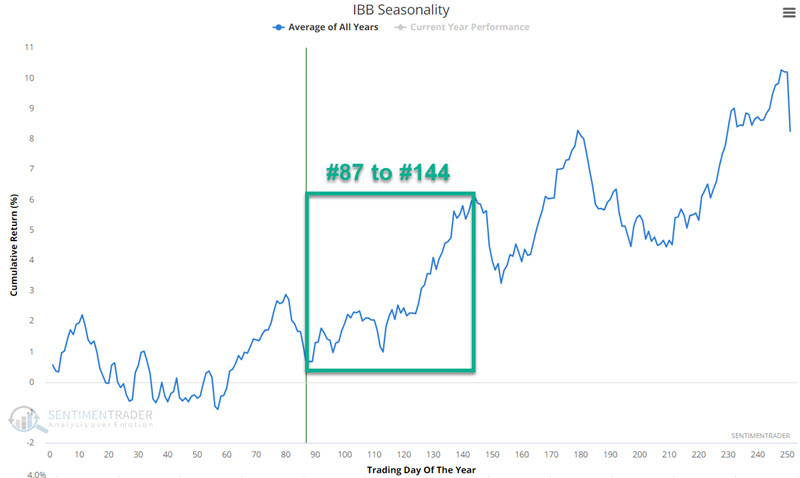
This favorable period extends from the close of Trading Day of the Year (TDY) #87 through TDY #144. For 2024, it extends from the close of 2024-05-06 through 2024-07-29. 

Historical performance during this favorable seasonal window

Ticker IBB started trading in 2001. The chart below displays the hypothetical growth of $1 invested in IBB only during the TDY #87 through TDY #144 period every year since then.

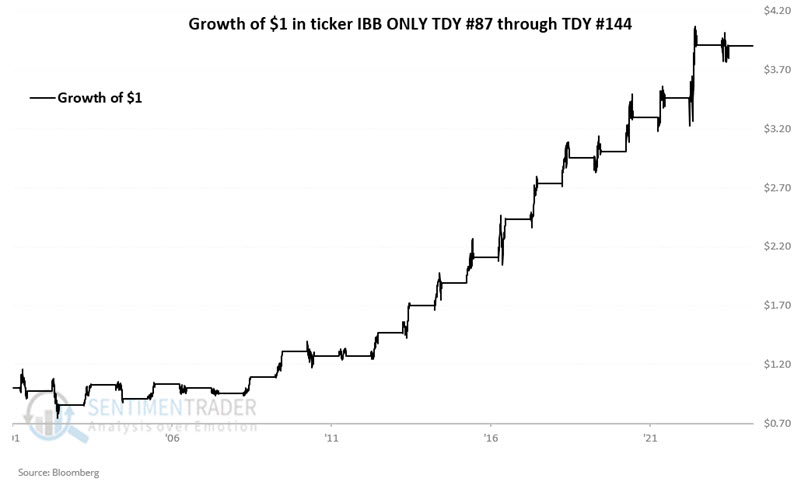
The table below summarizes IBB's performance during this period.

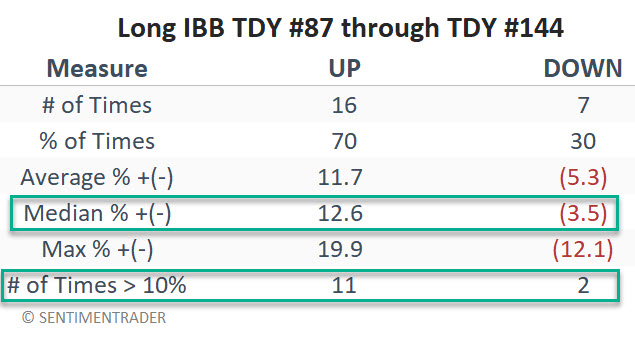
A Win Rate of 70% is good, but it also implies that this is not a sure thing. The most favorable signs are that the median gain is 3.6 times the median loss, and moves of 10% or more skew heavily to the positive side.

What the research tells us…

Remember that an annual seasonal trend chart (such as the one above) is an average of historical results and NOT a "roadmap" of what will happen in any particular year. The best use of seasonal trends (in this author's opinion) is to trade in the direction of the primary trend during those times when price and seasonality agree. A favorable configuration exists with IBB entering a favorable seasonal period and the share price (presently) above its 200-day average.

Jay's Trading Maxim #149: There are ALWAYS great potential opportunities. There are NEVER any guarantees.

PRODUCTS
SentimenTrader
Trading Tools
Indicators & Data API
‍
Strategies & Scanner
‍
Research Reports
FREE
RESOUrCES
Simple Backtest
Calculator
Simple Seasonality
Calculator
The Kelly Criterion
Calculator
Sentiment Geo Map
‍
Public Research Reports
‍
Education
Sentiment Indicators
‍
Technical Indicators
‍
Pricing
Bundle pricing
‍
FAQ
‍
Announcements
‍
COMPANY
‍
About
‍
In the News
‍
Testimonials
‍
Client Success Stories
CONTACT
‍
General Inquiries
‍
Media Inquiries
‍
Financial Professionals Inquiries
‍
© 2026 Sundial Capital Research Inc. All rights reserved.
Setsail Marketing
TermsPrivacyAffiliate Program
Risk Disclosure: The information and tools provided are for research and analytical purposes only and are not intended as investment advice. Market analysis involves uncertainty, and outcomes may differ from expectations. Users should conduct their own due diligence and consider their individual circumstances before making any financial decisions. Past performance is not necessarily indicative of future results.

Hypothetical Performance Disclosure: Hypothetical performance results have many inherent limitations, some of which are described below. No representation is being made that any account will or is likely to achieve profits or losses similar to those shown; in fact, there are frequently sharp differences between hypothetical performance results and the actual results subsequently achieved by any particular trading program. One of the limitations of hypothetical performance results is that they are generally prepared with the benefit of hindsight. In addition, hypothetical trading does not involve financial risk, and no hypothetical trading record can completely account for the impact of financial risk of actual trading. for example, the ability to withstand losses or to adhere to a particular trading program in spite of trading losses are material points which can also adversely affect actual trading results. There are numerous other factors related to the markets in general or to the implementation of any specific trading program which cannot be fully accounted for in the preparation of hypothetical performance results and all which can adversely affect trading results.

Testimonial Disclosure: Testimonials appearing on this website may not be representative of other clients or customers and is not a guarantee of future performance or success.