
It's time to keep (a wary) eye on platinum

Key points
- Platinum tried to follow gold's lead by rallying almost 30% between November 2023 and May 2024
- In the last two weeks, however, platinum has sold off 10%
- Seasonality strongly suggests caution for traders hoping for a quick rebound
Platinum has faltered following a multi-month rally
Platinum futures advanced almost 30% from November 2023 into late May 2024. Since then, prices have been falling hard - nearly 10% in two weeks.
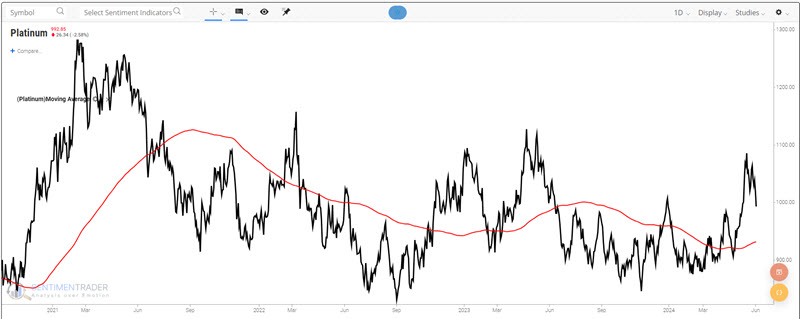
The trader's question is, "Will the selloff continue, or will the uptrend resume?" At this point, seasonality may be offering an important clue.
A period of significant seasonal weakness is about to begin
The chart below displays the annual seasonal trend for platinum futures. Note that this market will soon enter a significantly unfavorable seasonal period that extends from TDY #113 through TDY #128. For 2024, this period began at the close on 2024-06-06 through 2024-06-27.

As always, essential caveats apply. The adage that seasonality is "climate, not weather" is 100% applicable. Likewise, an annual seasonal trend chart such as the one above is merely an average of past performance and is not a roadmap of what will happen during any given year.
Considering those caveats, bulls should be wary, and bears should consider action.
The chart below displays the hypothetical cumulative $ +(-) achieved by holding a long position in platinum futures only during the end of TDY #113 through the end of TDY #128 every year since 1987.
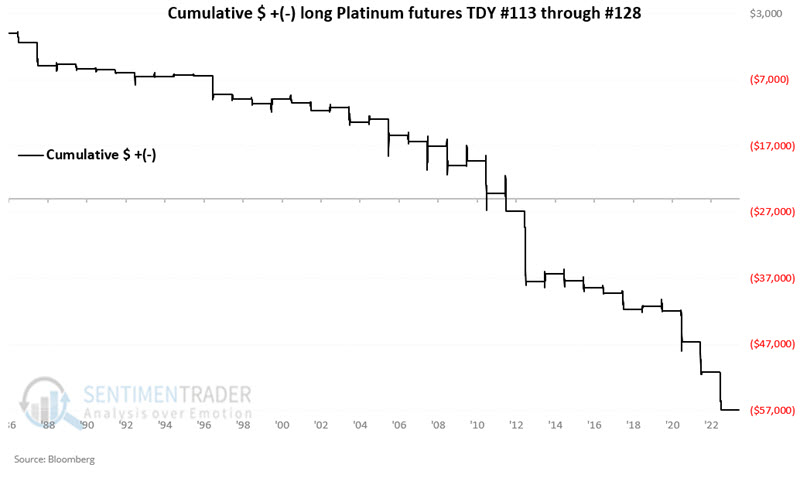
The chart above demonstrates the long-term downside bias during this period. However, as with any seasonal trend, price weakness during this period is not guaranteed in any given year. The table below summarizes platinum futures performance during this seasonal period.
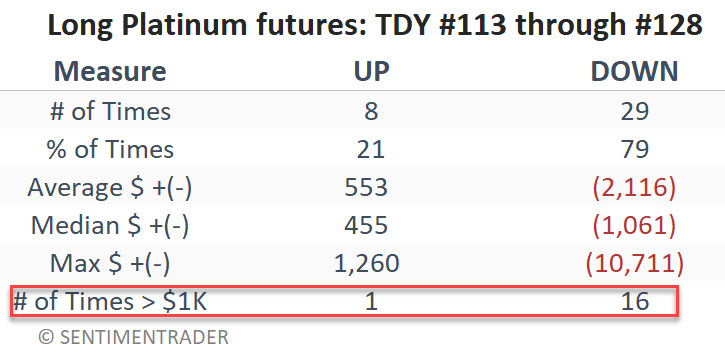
Historically, platinum's performance during this particular annual window can only be described as "dreadful." Note that periods greater than $1,000 in contract value (or 20.00 points in contract price) have skewed negatively by a somewhat astounding 16-to-1 ratio.
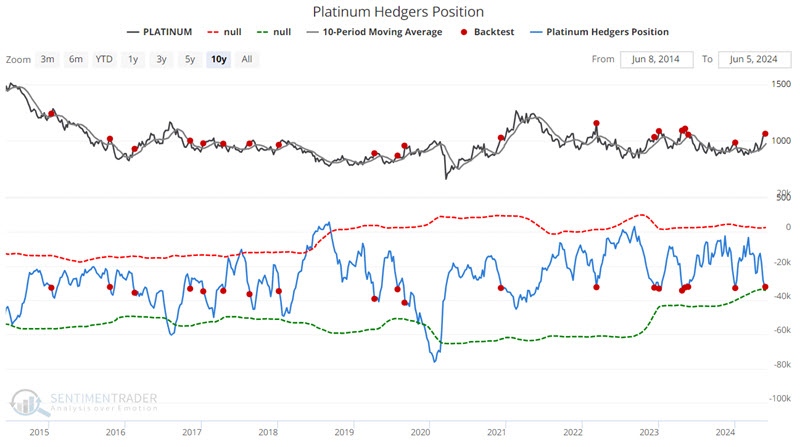
One other potential negative - hedgers positions
The following information is not something to rely upon as a standalone trading model. But as weight of the evidence, the current status dovetails nicely with a cautious approach towards platinum. The chart below highlights with a red dot those dates in the last ten years when Platinum Hedger's Position dropped below -32,000 while platinum futures were trading above their 10-day moving average. The most recent signal occurred on 2024-05-28.
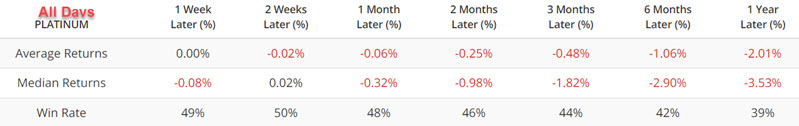
The table below displays platinum futures performance for all trading days in the last ten years.
The table below displays platinum futures performance only following the dates marked with a red dot in the chart above. Average returns, median returns, and Win Rates are all lower across the board.
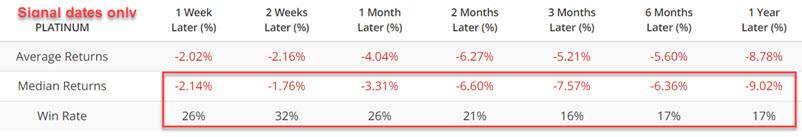
Does this "guarantee" that platinum futures are headed lower? Not at all. But it does lend further weight of the evidence to the unfavorable side of the ledger.
What the research tells us…
Over the past 37 years, platinum futures have demonstrated a persistent tendency to perform especially poorly during the early June to late June period. But there is no guarantee on a year-to-year basis that this tendency will play out as expected, and traders are never encouraged to risk money based solely on a previous seasonal tendency unquestioningly. That said, a trader should have a compelling reason to trade the long side of platinum in the weeks ahead, and aggressive futures traders should carefully consider a potential opportunity to play the short side.