
It's time to keep a (wary) eye on natural gas

Key Points
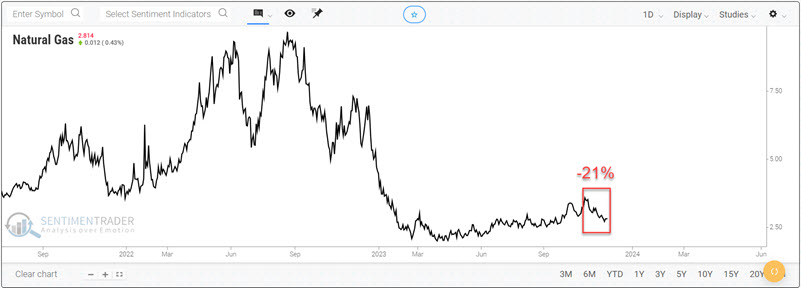
- Natural gas has plunged in recent weeks, reaching a relatively oversold level
- Nevertheless, this highly cyclical market is entering a period that often witnesses extreme weakness
- Bears may look to press their bets, and bulls might look for some corroborating evidence before testing the long side
A bearish seasonal period is now upon us
Natural gas has declined -21% since the end of October. We see this decline in the chart below.
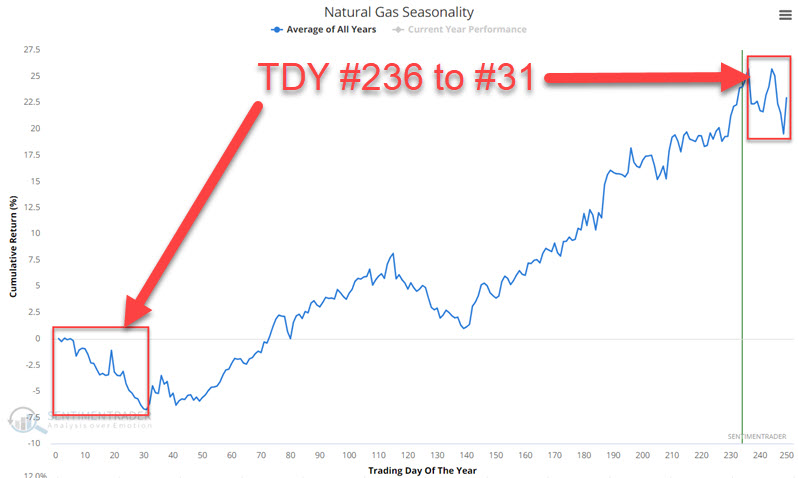
Conventional wisdom suggests a reflex rally of some sort is due. However, the chart below displays the annual seasonal trend for natural gas futures. This market is entering a seasonally unfavorable period that extends from Trading Day of Year #236 through TDY #31 of the following year. For 2023-24, this period extends from the close on 2023-12-04 through the close on 2004-02-15.
The chart below displays the cumulative $ +(-) for holding a long position in natural gas futures only from TDY #236 through TDY #31 the following year since natural gas started trading in 1990.
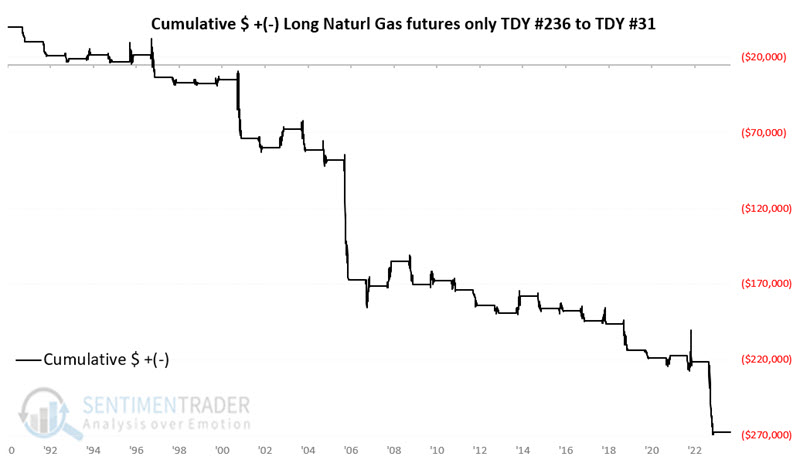
Even a quick perusal of the chart above clarifies why a trader might think twice about trying to play for a bounce in natural gas - even despite its currently oversold status. While anything could happen, swimming upstream is generally a more challenging and less rewarding approach.
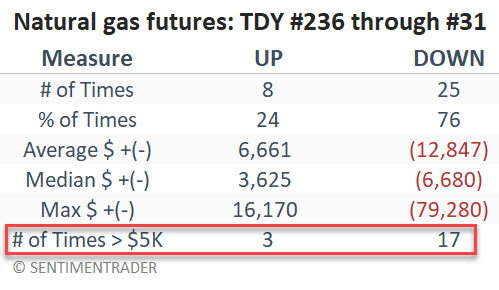
During this seasonal window, natural gas declined for 25 out of 33 years. Likewise, significant $5,000 or more moves have skewed to the negative side 17 times to only three times to the positive side.
Considering ETFs instead of futures contracts
Natural gas futures trading is only for very well-capitalized traders. On the other hand, ETFs can allow anyone to access the market. The United States Natural Gas Fund (UNG) is designed to track the price of natural gas futures. Even more so than many other commodity-related ETFs, UNG has a nasty long-term downward bias due to persistent contango in the futures market.
The chart below displays the cumulative percentage return for holding a long position in ticker UNG only from TDY #236 through TDY #31 the following year since trading inception in 2007. Note that the cumulative loss for this period is pretty stunning at -93.6%. Repeating: Swimming upstream is not a good way to put the odds in your favor.
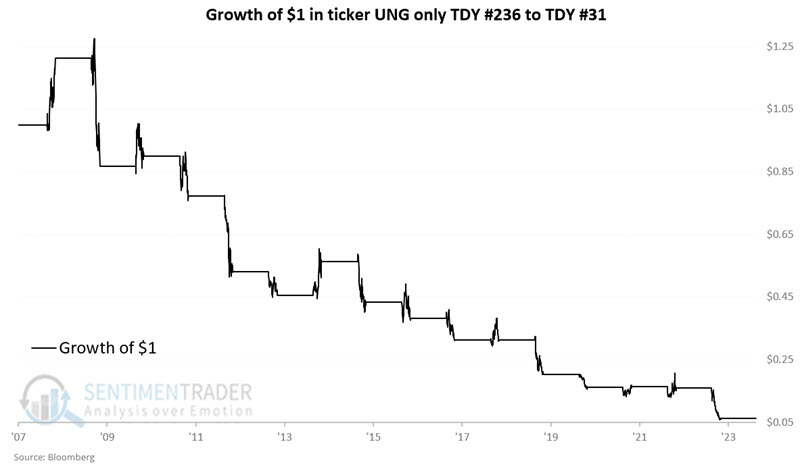
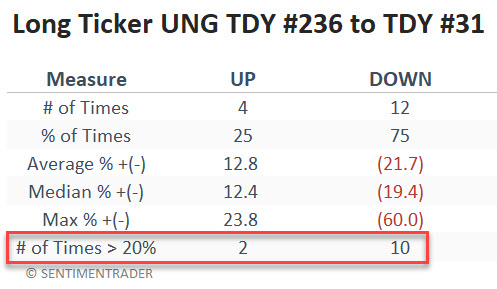
Out of the 16 years in its history, UNG suffered a loss during these seasonal windows 12 times, with ten losses of -10 % or more.
Aggressive traders who want to play the short side and are willing to accept a very high degree of risk and volatility might look at ticker KOLD. The ProShares UltraShort Bloomberg Natural Gas ETF (KOLD) is designed to track two times the inverse daily performance for natural gas futures. But make no mistake about the highly volatile and risky nature of investing in this ETF.
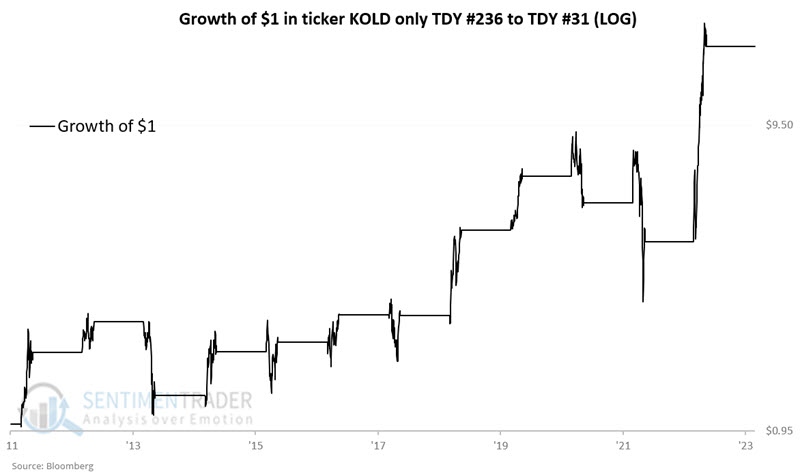
For better or worse, the chart and table below display the results for holding a long position in ticker KOLD only from TDY #236 through TDY #31 the following year since trading inception in 2011. Over eleven years, the cumulative gain is +1,619%, albeit with several harrowing drawdowns interspersed.
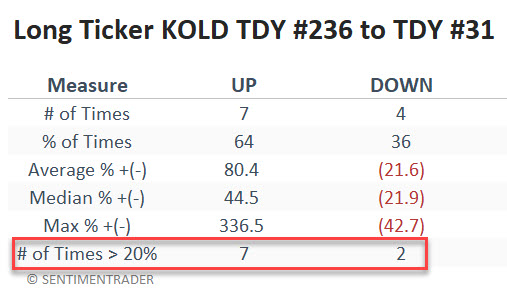
The table below summarizes KOLD's performance during this seasonal window.
To fully illustrate the wildly volatile nature of UNG and KOLD, the table below displays the year-by-year performance for these two ETFs during the TDY #236 to TDY #31 period.
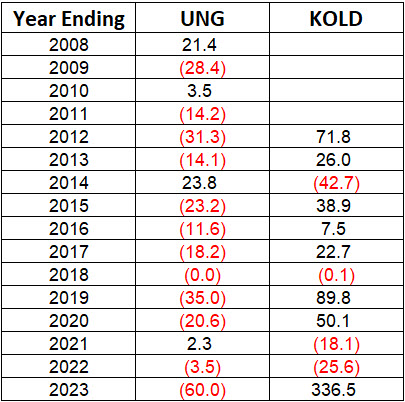
During a roughly two-and-a-half-month window, ticker KOLD has enjoyed gains of +336.5%, +89.8%, +71.8% and +50%. However, during this same seasonal window, it has also registered losses of -42.7%, -25.6%, and -18.1%. This ETF is clearly not for the faint of heart, the undercapitalized, or those inclined to take overly large positions.
What the research tells us...
One of the keys to succeeding as a trader is focusing on putting the odds on your side to the greatest extent possible with each trade. The caveat is that even if you do this, there will be trades that end up going the wrong way. Natural gas has suffered a significant (and relatively relentless) decline since the end of October. As a result, many traders may be looking for a bounce and/or eschewing the short side of this volatile market. Nevertheless, the seasonal window highlighted above has often - though notably, not always - witnessed surprisingly sharp weakness in natural gas prices. The history suggests that traders looking to put the odds in their favor look for opportunities to play the short side of natural gas between now and mid-February 2024.