Products
SentimenTrader Trading Tools
‍
Backtest Engine
My Trading Toolkit
Correlation Analysis
Seasonality
Market Prediction
Indicators & Data API
‍
Proprietary Indicators & Charts
Market Data API
Strategies & Scanner
‍
50+ Trading Strategies
Smart Stock Scanner
Smart Option Scanner
Research Reports
‍
Research Solutions
Reports Library
Free Resources
Simple Backtest Calculator
Simple Seasonality Calculator
The Kelly Criterion Calculator
Sentiment Geo Map
Public Research Reports
Education
Sentiment Indicators
Technical Indicators
Pricing
Company
About
In the News
Testimonials
Client Success Stories
Contact
Log inLoginSign up
< BACK TO ALL REPORTS

It's time to keep a close eye on technology

Jay Kaeppel
2022-08-31
The technology sector is entering a seasonally unfavorable period. Since 1927 the results are slightly better than a coin flip on a winners-to-losers basis. However, on an overall return basis, the results are decidedly negative. Look at the long-term history to understand what you might expect in the weeks ahead.

Key Points

  • Technology is about to enter its weakest seasonal period of the year
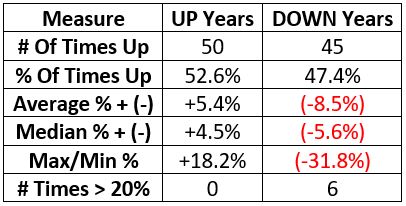
  • The good news is that the Win Rate for the technology sector during this period is slightly favorable (52.6%)
  • The bad news is that the overall performance for the sector has been decidedly bearish (-79.4%)
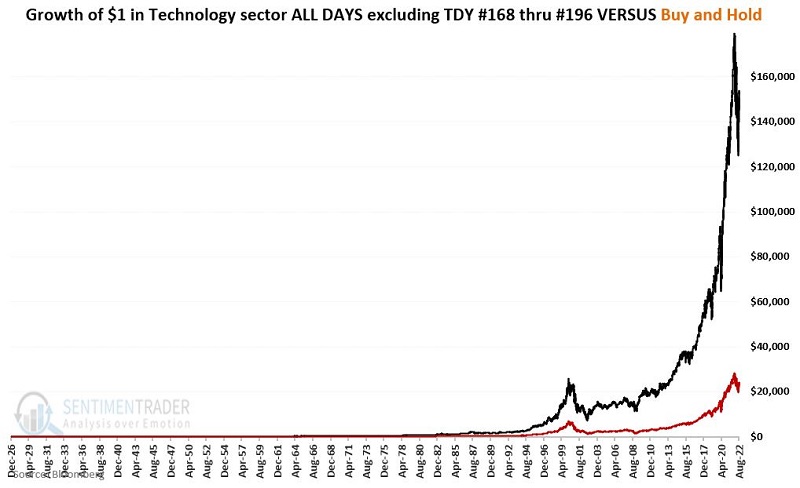
  • Avoiding tech only during this period and holding the rest of the time would have outperformed buy-and-hold by a factor of six

Technology seasonality

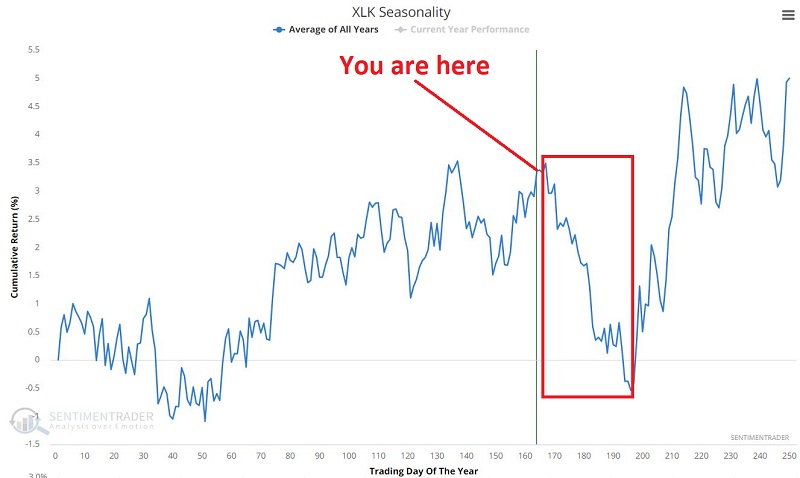
The chart below displays the annual seasonal trend for the technology sector (using ticker XLK as a proxy). As you can see, this key sector is about to enter a period of general price weakness that extends from the close on Trading Day of the Year (TDY) #167 through TDY #196. For 2022 this period extends from the close on 2022-08-31 through 2022-10-12.

Testing performance results

For testing, our dataset uses the Information Technology sector data from the Fama French database from 1927 to 1990 and then the S&P 500 Information Technology sector index after that. NOTE: Before 1953, the NYSE was open for trading for several hours on Saturday (shhhh!! Don't give them any ideas!). This resulted in roughly 52 additional trading days per year before 1953. For this test, Saturdays are omitted, and I only counted trading days that fell on Monday through Friday.

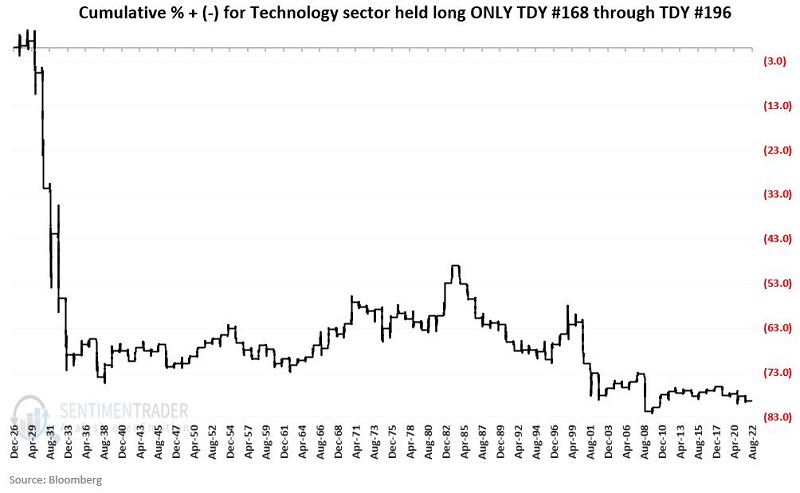
The chart below displays the cumulative % +(-) for the technology sector held long only during Trading Day of Year #168 through TDY #196 since 1927. 

The table below displays a summary of performance.

A closer look

We can make some general observations regarding technology performance during this particular seasonal period over the past 95 years:

  • From 1929 through 1933, the technology sector lost -69.5% during the TDY #167-TDY #196 period
  • From 1933 through 2021, the technology sector lost another -34% during the TDY #167-TDY #196 period
  • While the overall result has been a net decline of -79.4%, the fact remains that this period has shown a gain (50 times) more often than it has shown a loss (45 times)

The last item is a reminder that seasonality has limitations and that anything can happen during any given year. Nevertheless, the overall performance suggests that investors may be wise to avoid the tech sector or hedge their bets during this late summer/early fall period.

To put things into as clear of a perspective as possible, consider the chart below. The brown line displays the growth of $1 invested in the technology sector on a buy-and-hold basis. The black line shows the growth of $1 invested in the technology sector during all trading days EXCEPT for TDY #168 through TDY #196.

What the research tells us…

In reality, anything can happen with technology stocks in the weeks ahead. Based on the results above, it is a mistake to assume that the tech sector is doomed to decline in the weeks ahead. However, history suggests it is also unwise to whistle past the graveyard and hope everything will work out well between 2022-08-31 and 2022-10-12.

PRODUCTS
SentimenTrader
Trading Tools
Indicators & Data API
‍
Strategies & Scanner
‍
Research Reports
FREE
RESOUrCES
Simple Backtest
Calculator
Simple Seasonality
Calculator
The Kelly Criterion
Calculator
Sentiment Geo Map
‍
Public Research Reports
‍
Education
Sentiment Indicators
‍
Technical Indicators
‍
Pricing
Bundle pricing
‍
FAQ
‍
Announcements
‍
COMPANY
‍
About
‍
In the News
‍
Testimonials
‍
Client Success Stories
CONTACT
‍
General Inquiries
‍
Media Inquiries
‍
Financial Professionals Inquiries
‍
© 2026 Sundial Capital Research Inc. All rights reserved.
Setsail Marketing
TermsPrivacyAffiliate Program
Risk Disclosure: The information and tools provided are for research and analytical purposes only and are not intended as investment advice. Market analysis involves uncertainty, and outcomes may differ from expectations. Users should conduct their own due diligence and consider their individual circumstances before making any financial decisions. Past performance is not necessarily indicative of future results.

Hypothetical Performance Disclosure: Hypothetical performance results have many inherent limitations, some of which are described below. No representation is being made that any account will or is likely to achieve profits or losses similar to those shown; in fact, there are frequently sharp differences between hypothetical performance results and the actual results subsequently achieved by any particular trading program. One of the limitations of hypothetical performance results is that they are generally prepared with the benefit of hindsight. In addition, hypothetical trading does not involve financial risk, and no hypothetical trading record can completely account for the impact of financial risk of actual trading. for example, the ability to withstand losses or to adhere to a particular trading program in spite of trading losses are material points which can also adversely affect actual trading results. There are numerous other factors related to the markets in general or to the implementation of any specific trading program which cannot be fully accounted for in the preparation of hypothetical performance results and all which can adversely affect trading results.

Testimonial Disclosure: Testimonials appearing on this website may not be representative of other clients or customers and is not a guarantee of future performance or success.