Products
SentimenTrader Trading Tools
‍
Backtest Engine
My Trading Toolkit
Correlation Analysis
Seasonality
Market Prediction
Indicators & Data API
‍
Proprietary Indicators & Charts
Market Data API
Strategies & Scanner
‍
50+ Trading Strategies
Smart Stock Scanner
Smart Option Scanner
Research Reports
‍
Research Solutions
Reports Library
Free Resources
Simple Backtest Calculator
Simple Seasonality Calculator
The Kelly Criterion Calculator
Sentiment Geo Map
Public Research Reports
Education
Sentiment Indicators
Technical Indicators
Pricing
Company
About
In the News
Testimonials
Client Success Stories
Contact
Log inLoginSign up
< BACK TO ALL REPORTS

it's time to keep a close eye on soybeans

Jay Kaeppel
2023-07-12
Soybeans are entering the typically weakest time of the year. As always, seasonality is "climate, another weather." That said, history suggests that traders look for opportunities to play the short side in the months ahead.

Key points

  • Due to the nature of the planting cycle, soybeans are a highly cyclical market
  • Beans are entering their weakest seasonal period of the year
  • Results can vary widely year-to-year, but seasonal weakness in beans is one of the more reliable seasonal commodity trends

First, an update on corn

In this article dated 2023-05-31, I pointed out that corn tends to show weakness in June. June 2023 perfectly illustrated the potential benefits and limitations of seasonal trends. The chart below shows price action for Corn futures in recent months.

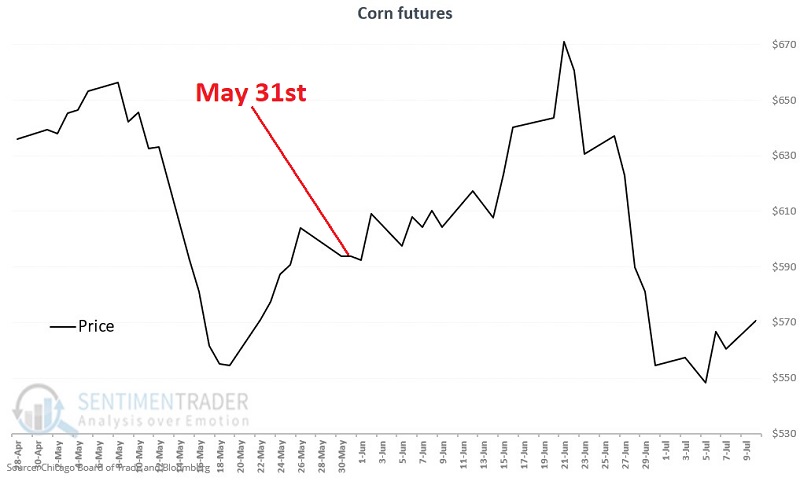
The good news is that corn futures did lose ground during June, as expected. The value of a corn futures contract is roughly $1,200 lower than it was on 2023-05-31. The bad news is that the value of a corn futures contract first rallied over $5,300 in value before plunging. 

A trader who relied solely on a bearish seasonal tendency and sold short on May 31st would have had to sit through an open loss of over -$5,300 to garner the current open profit. This type of blind allegiance to any given seasonal trend is not recommended. No matter how historically reliable any trend or indicator has proven to be, the individual trader is never relieved of their duty to thoughtfully allocate capital and ruthlessly manage risk.

Soybeans are now entering a significant period of seasonal weakness

The chart below displays the annual seasonal trend for soybean futures.

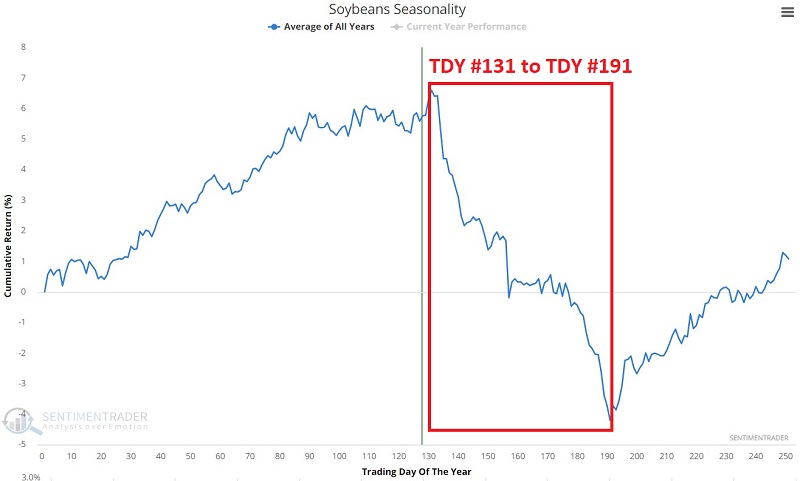
Identifying the weakest time of year is not difficult. The red box highlights the period that extends from the close on Trading Day of Year #131 through TDY #191. For 2023 this period extends from the close on 2023-07-12 through the close on 2023-10-09.

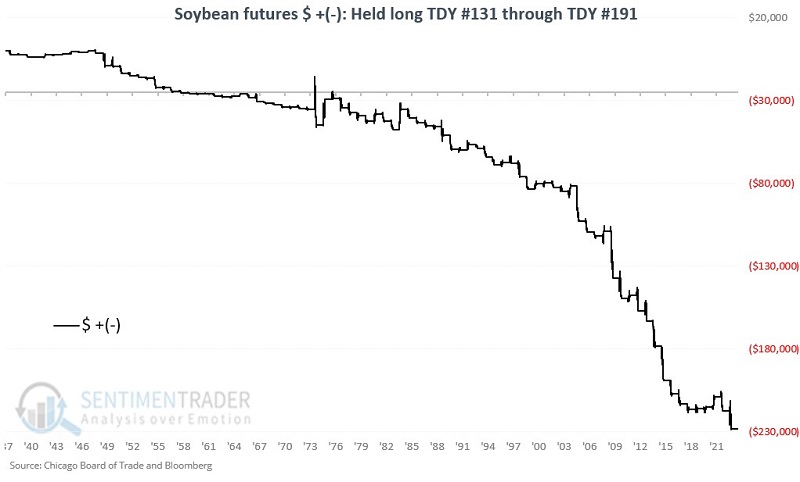
The chart below displays the hypothetical cumulative $ +(-) from holding a long position in soybean futures only during this unfavorable period every year since 1937.

The table below summarizes soybean futures performance during this unfavorable period.

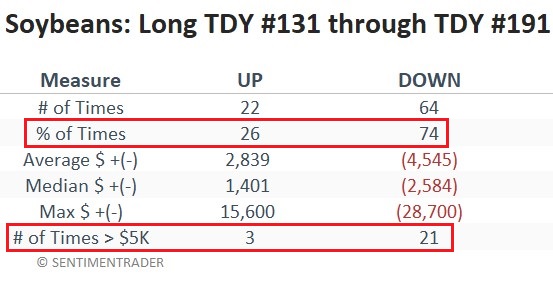
Clearly, the probabilities favor the downside during this period. 74% of the past 86 years have witnessed lower soybean prices during this period. Also note that there have been 21 years that saw soybean futures decline -$5,000 or more, but only three years showed a gain of $5K or more.

The trading reality, however, is that in any given year, anything can happen. In 1974 soybean futures rallied over $15,600, and in 1983 the gain was almost $12,000.

What the research tells us…

Seasonality tells a trader "where to look" for trading opportunities and "in which direction to lean." Beyond that, there are no guarantees. With that caveat in mind, it seems logical that traders should look for opportunities to play the short side of soybeans between now and early October.

PRODUCTS
SentimenTrader
Trading Tools
Indicators & Data API
‍
Strategies & Scanner
‍
Research Reports
FREE
RESOUrCES
Simple Backtest
Calculator
Simple Seasonality
Calculator
The Kelly Criterion
Calculator
Sentiment Geo Map
‍
Public Research Reports
‍
Education
Sentiment Indicators
‍
Technical Indicators
‍
Pricing
Bundle pricing
‍
FAQ
‍
Announcements
‍
COMPANY
‍
About
‍
In the News
‍
Testimonials
‍
Client Success Stories
CONTACT
‍
General Inquiries
‍
Media Inquiries
‍
Financial Professionals Inquiries
‍
© 2026 Sundial Capital Research Inc. All rights reserved.
Setsail Marketing
TermsPrivacyAffiliate Program
Risk Disclosure: The information and tools provided are for research and analytical purposes only and are not intended as investment advice. Market analysis involves uncertainty, and outcomes may differ from expectations. Users should conduct their own due diligence and consider their individual circumstances before making any financial decisions. Past performance is not necessarily indicative of future results.

Hypothetical Performance Disclosure: Hypothetical performance results have many inherent limitations, some of which are described below. No representation is being made that any account will or is likely to achieve profits or losses similar to those shown; in fact, there are frequently sharp differences between hypothetical performance results and the actual results subsequently achieved by any particular trading program. One of the limitations of hypothetical performance results is that they are generally prepared with the benefit of hindsight. In addition, hypothetical trading does not involve financial risk, and no hypothetical trading record can completely account for the impact of financial risk of actual trading. for example, the ability to withstand losses or to adhere to a particular trading program in spite of trading losses are material points which can also adversely affect actual trading results. There are numerous other factors related to the markets in general or to the implementation of any specific trading program which cannot be fully accounted for in the preparation of hypothetical performance results and all which can adversely affect trading results.

Testimonial Disclosure: Testimonials appearing on this website may not be representative of other clients or customers and is not a guarantee of future performance or success.