Products
SentimenTrader Trading Tools
‍
Backtest Engine
My Trading Toolkit
Correlation Analysis
Seasonality
Market Prediction
Indicators & Data API
‍
Proprietary Indicators & Charts
Market Data API
Strategies & Scanner
‍
50+ Trading Strategies
Smart Stock Scanner
Smart Option Scanner
Research Reports
‍
Research Solutions
Reports Library
Free Resources
Simple Backtest Calculator
Simple Seasonality Calculator
The Kelly Criterion Calculator
Sentiment Geo Map
Public Research Reports
Education
Sentiment Indicators
Technical Indicators
Pricing
Company
About
In the News
Testimonials
Client Success Stories
Contact
Log inLoginSign up
< BACK TO ALL REPORTS

It's time to keep a close eye on small-caps

Jay Kaeppel
2022-10-18
The small-cap sector is beginning to show signs of life. Positive relative strength relative to large caps, a favorable seasonal period, and a bevy of oversold breadth readings alerts us to look for opportunities in this sector.

Key points:

  • Small-caps have entered their most favorable seasonal period of the year
  • They do so accompanied by improving relative strength versus large-caps
  • A potential tailwind from a variety of oversold breadth indicators also exists

The best time of year for small-caps has begun

Small-cap stocks are entering their best time of the year, and a bevy of breadth indicators should give them even more support.

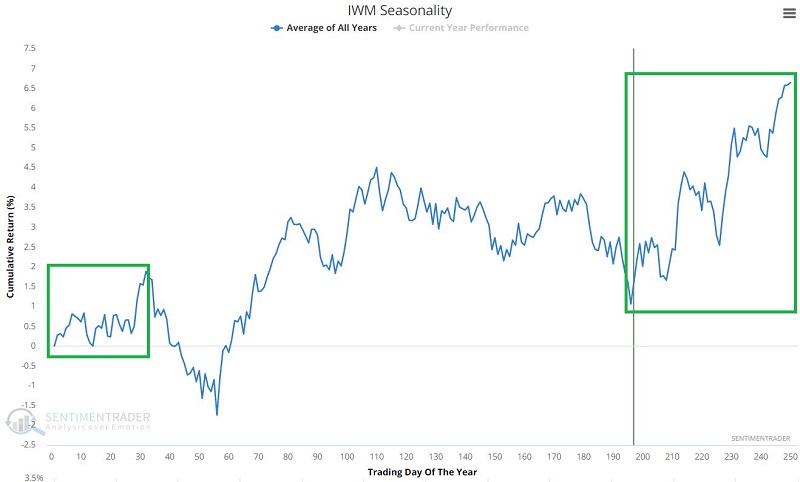
The chart below displays the annual seasonal trend for the iShares Russell 2000 ETF (IWM), which tracks the Russell 2000 small-cap index. Note that the index has just entered a seasonally favorable period that extends from the close on Trading Day of Year (TDY) # 196 through TDY #32 of the following year. This period began on the close of October 12 and will run into early February 2023.

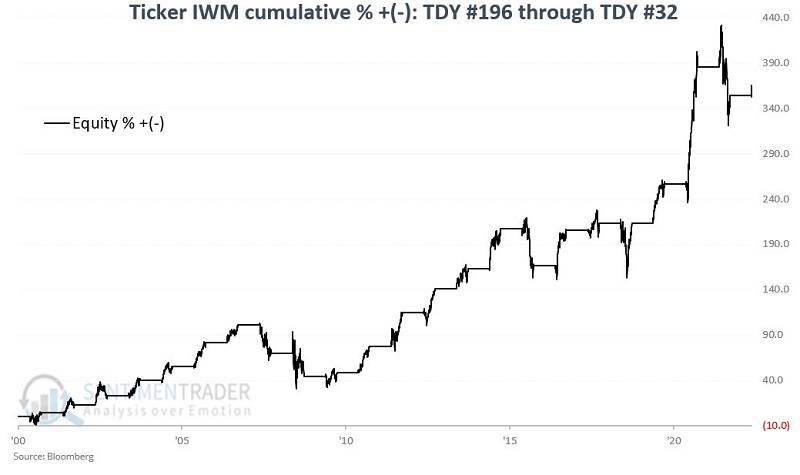
The chart below shows the cumulative percentage return for IWM if held only during these seasonal stretches.

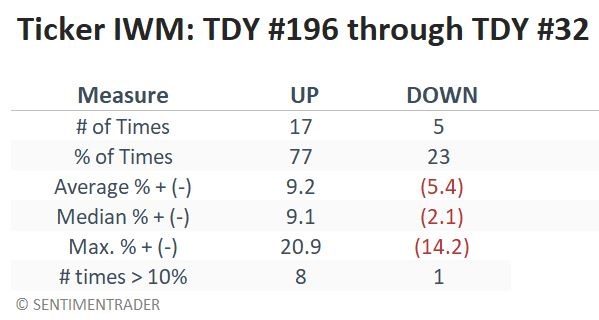
The table below shows that IWM rose 17 out of 22 times, with a much higher probability for large gains than large losses.

Small-cap relative performance is creeping higher

Small caps significantly underperformed large caps for much of the past decade. As a result, recency bias likely causes many investors to shy away from small-caps.

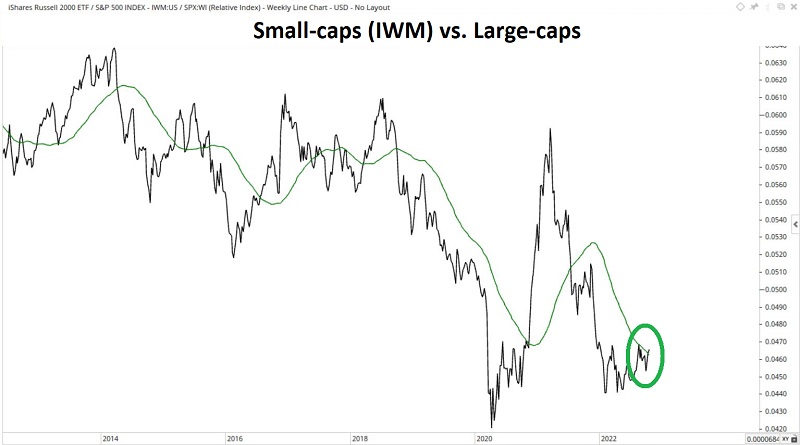
The reality is that neither large-cap nor small-cap enjoys a permanent advantage, and the pendulum typically swings back and forth over many years. The chart below displays the performance of IWM relative to SPDR S&P 500 ETF (SPY). Small-caps are presently trying to establish an uptrend versus large-caps. 

Oversold breadth indicators align on the bullish side

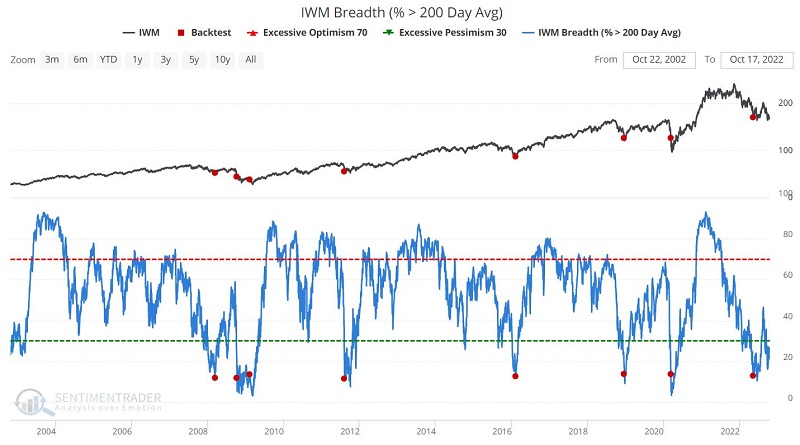
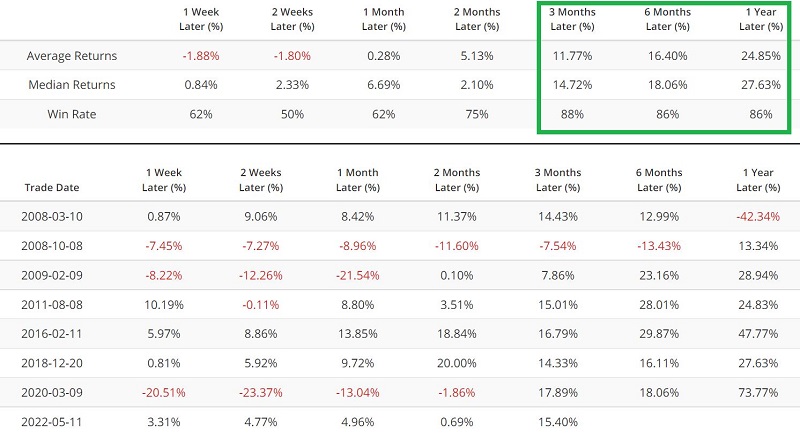
The chart below displays those times when the percentage of IWM constituent stocks above their 200-day moving average dropped below 14% for the first time in four months. The table summarizes subsequent IWM performance. Signals tend to be early, but three, six and twelve-month results are compelling. It triggered earlier this summer, so we're in the favorable part of its historical tendency.

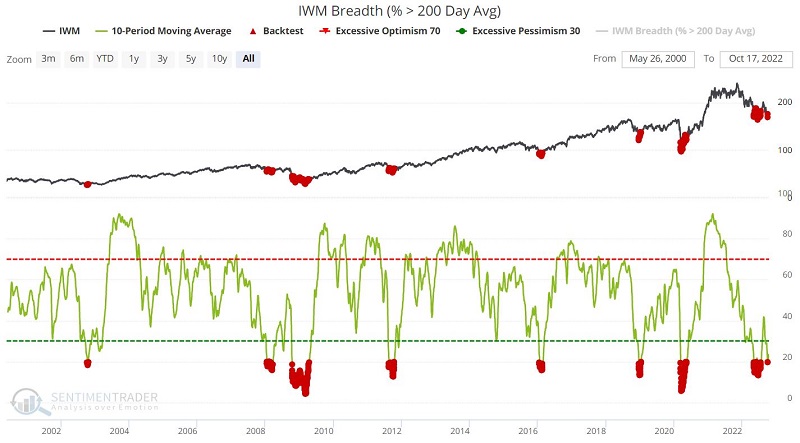
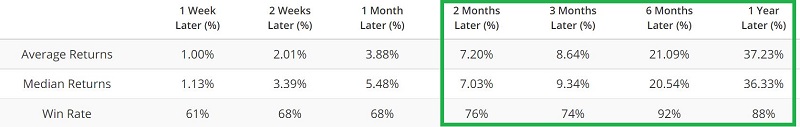
The chart and table below track a slight variation of the indicator above. This version identifies all days when the 10-day average of the above indicator is below 20%.

The final indicator identifies those days when the 20-day average of the IWM McClellan Summation Index crossed below -1000 for the first time in six months. Again, this triggered during the May selloff and while it has come back down again, isn't quite at the same extreme.

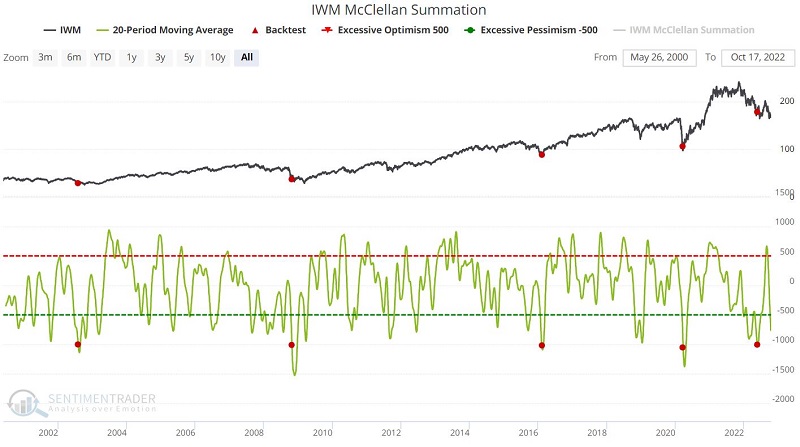
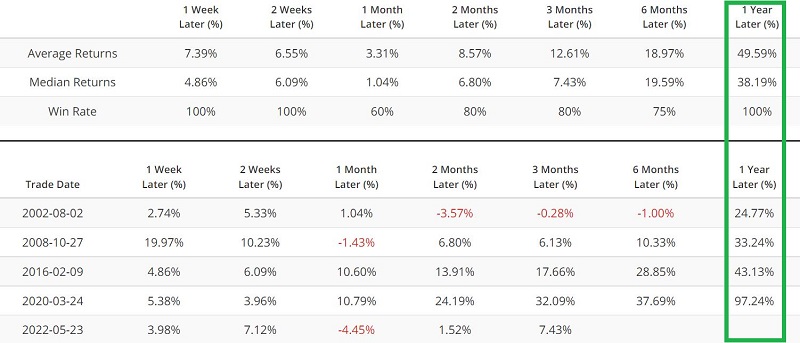
The signals from all three indicators have typically been followed by favorable price action over the next twelve months. As always, past performance does not guarantee positive results this time around. But they do offer some solid confirmation.

What the research tells us…

After a decade of underperformance, small-cap stocks may be poised to return to the forefront. At the moment, a confluence of potentially favorable indications may be forming. The combination of favorable seasonality, improving relative strength (compared to large-caps), and oversold breadth indicators hopefully point to an opportunity in the small-cap sector.

PRODUCTS
SentimenTrader
Trading Tools
Indicators & Data API
‍
Strategies & Scanner
‍
Research Reports
FREE
RESOUrCES
Simple Backtest
Calculator
Simple Seasonality
Calculator
The Kelly Criterion
Calculator
Sentiment Geo Map
‍
Public Research Reports
‍
Education
Sentiment Indicators
‍
Technical Indicators
‍
Pricing
Bundle pricing
‍
FAQ
‍
Announcements
‍
COMPANY
‍
About
‍
In the News
‍
Testimonials
‍
Client Success Stories
CONTACT
‍
General Inquiries
‍
Media Inquiries
‍
Financial Professionals Inquiries
‍
© 2026 Sundial Capital Research Inc. All rights reserved.
Setsail Marketing
TermsPrivacyAffiliate Program
Risk Disclosure: The information and tools provided are for research and analytical purposes only and are not intended as investment advice. Market analysis involves uncertainty, and outcomes may differ from expectations. Users should conduct their own due diligence and consider their individual circumstances before making any financial decisions. Past performance is not necessarily indicative of future results.

Hypothetical Performance Disclosure: Hypothetical performance results have many inherent limitations, some of which are described below. No representation is being made that any account will or is likely to achieve profits or losses similar to those shown; in fact, there are frequently sharp differences between hypothetical performance results and the actual results subsequently achieved by any particular trading program. One of the limitations of hypothetical performance results is that they are generally prepared with the benefit of hindsight. In addition, hypothetical trading does not involve financial risk, and no hypothetical trading record can completely account for the impact of financial risk of actual trading. for example, the ability to withstand losses or to adhere to a particular trading program in spite of trading losses are material points which can also adversely affect actual trading results. There are numerous other factors related to the markets in general or to the implementation of any specific trading program which cannot be fully accounted for in the preparation of hypothetical performance results and all which can adversely affect trading results.

Testimonial Disclosure: Testimonials appearing on this website may not be representative of other clients or customers and is not a guarantee of future performance or success.