
Its time to keep a close eye on leading economic indicators

Key points
- The Conference Board Index of Leading Economic Indicators continues to plunge
- This usually portends an impending economic recession
- There is a simple signal that investors should be looking for to know when the worst may be over for stocks
The data we use
The Conference Board Index of Leading Economic Indicators (LEI) typically rises and falls before pickups and slowdowns in the economy. The chart below displays the number of consecutive months the LEI index declined. When the chart below reads 0, it means the LEI index is rising.
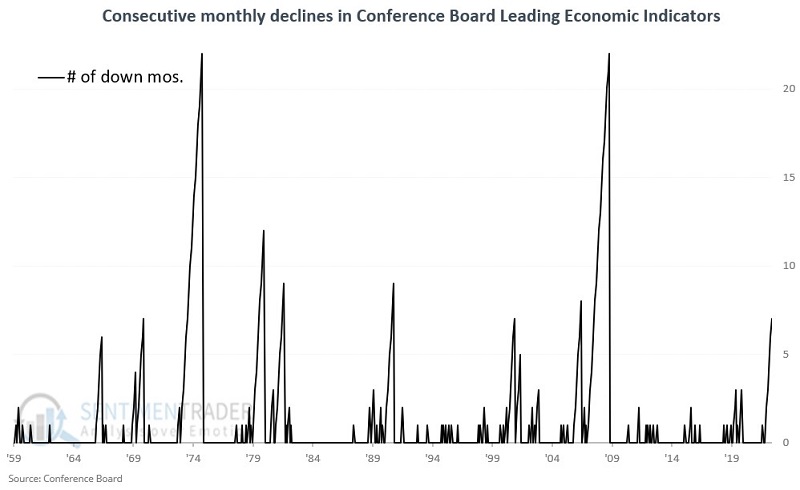
As you can see, depending on the depth of economic weakness, a downturn can last for a month or two to almost two years (the 1973-1975 and 2007-2009 downturns both saw LEI decline for 22 straight months). Because of the variability in the lengths of economic declines, I have opted for a more straightforward approach to using LEI declines as a stock market indicator.
Note that LEI readings have a one-month lag. Also, I update the indicator below only at the end of the month. So, for example, the LEI number for November 2022 is reported during the month of December. I will use that latest value to update the indicator below as of 2022-12-31.
Looking for a reversal off of a six-month low
The first thing to note is that not every indicator is a trading system. In essence, the indicator described below should not be considered a "buy signal" per se but more of an "economic all clear" sign that adds significant weight to the bullish side of the stock market outlook ledger.
The signal is pretty straightforward:
- An economic "all clear" signal occurs when the LEI rises 0.7 points or more above a sixth low
Note that the LEI has declined for seven consecutive months with a reading of 113.50. So, if the December 2022 LEI value (which will come out sometime during January 2023) were to rise to 114.20 or higher, a new favorable signal would occur (for my purposes, that new favorable signal would take effect at the end of January 2023). However, the reality is that it could take any number of months for the LEI to rebound 0.70 points off of a low.
The most recent completed favorable signal occurred on 2020-06-30, followed by a strong rebound in the stock market.
The results
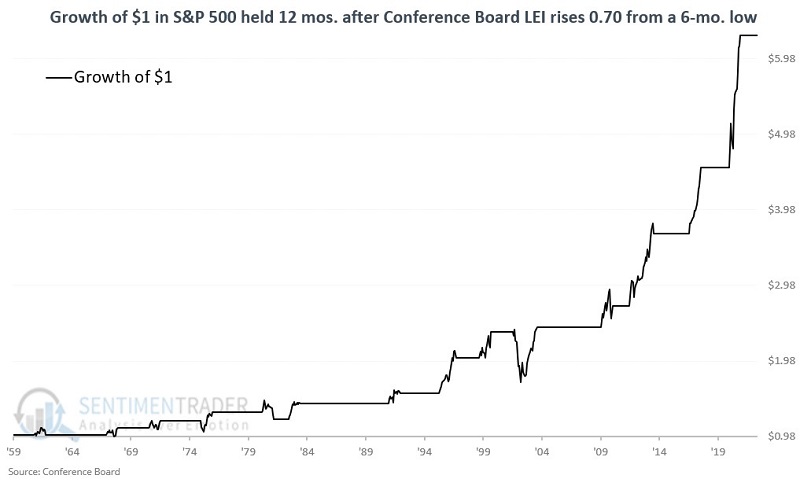
The chart below displays the cumulative growth of $1 invested in the S&P 500 Index only during the twelve months following each signal described above.
The table below displays the performance of the S&P 500 Index following each signal.
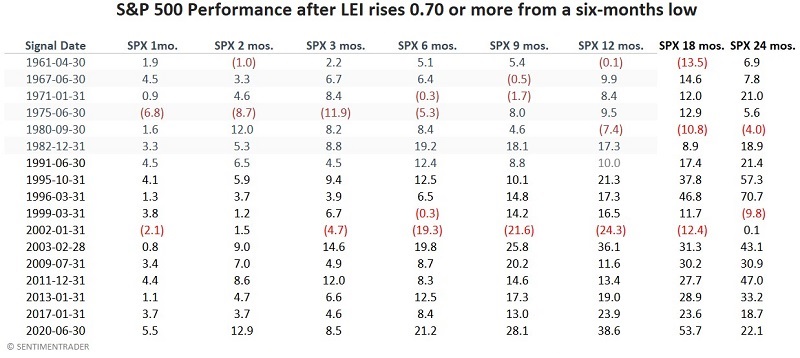
Not every signal in the table above "guaranteed" strong stock market performance. The most untimely signal occurred in January 2002, as the market plunged for another year. Hence the reason this method is not touted as a standalone trading model. Still, overall results have been consistently well above average.
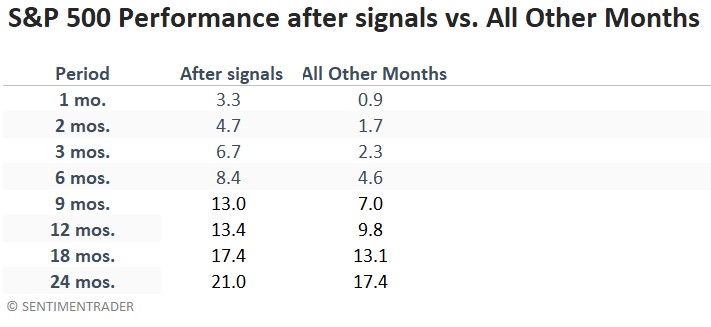
The table below displays the median percentage returns following signals versus median results for all other months (i.e., all months when an LEI reversal signal did not occur).
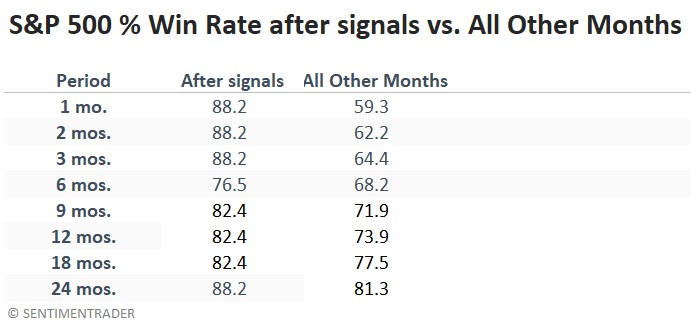
The table below displays the % Win Rate following signals versus median results for all other months (i.e., all months when an LEI reversal signal did not occur).
What the research tells us…
Economic downturns can be short and sharp or long and drawn out. It is typically impossible to predict. But one thing that history does show is that the stock market is one of the best economic indicators around. As soon as it gets a whiff of impending recovery - even in the heart of a painful economic decline - it often goes "off to the races." One way to anticipate this scenario is to closely monitor the leading economic indicators for signs of a reversal. The one thing that is probably impossible is predicting when that reversal will occur. It could happen next month (though that appears unlikely), or it could be another year or more. This one requires some patience.
Sorry folks, I don't make the rules.