
It's time to keep a close eye on emerging markets

Key points
- Emerging markets have been showing signs of strength of late
- As a general rule, investors are best off not fighting a prevailing trend
- However, in the case of emerging markets, traders should remain extremely alert to signs of a reversal - and stand ready to act
Emerging markets have been building a positive trend
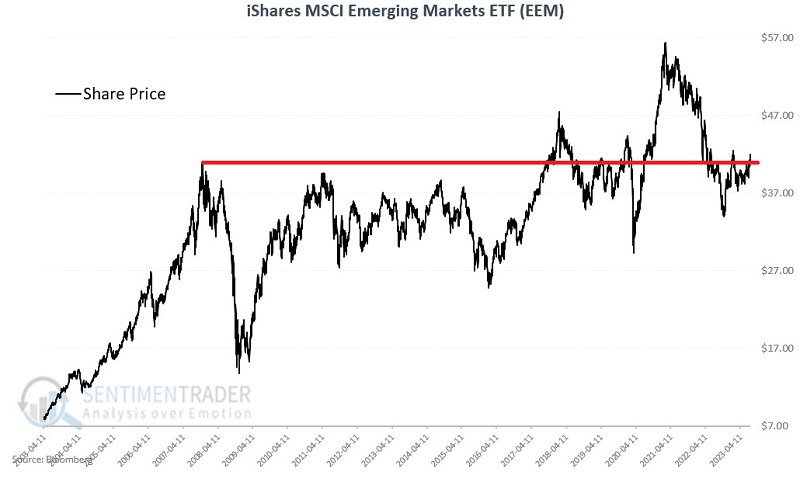
The chart below shows that the iShares MSCI Emerging Markets ETF (ticker EEM) has once again poked its head above a critical long-term resistance level. The key question is, "Is this a meaningful breakout or another head fake?"
The chart below zooms in on price action in recent years.
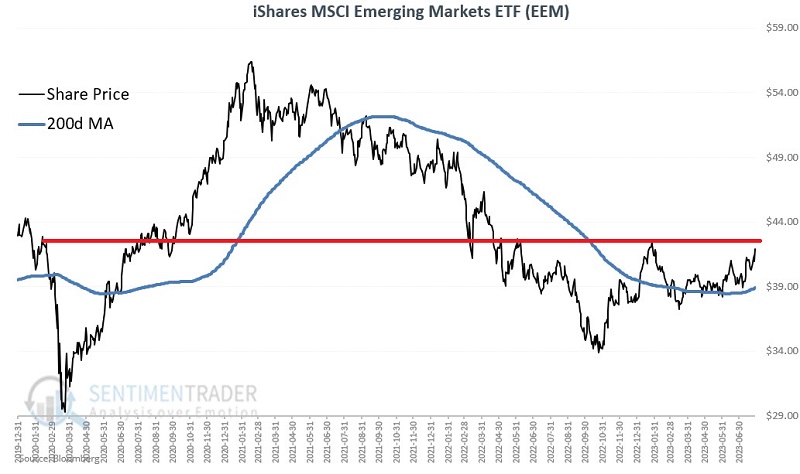
The good news is that the price has moved above the 200-day moving average, and the 200-day moving average has begun to rise. This is generally a favorable configuration. However, there are two reasons to be wary. The red horizontal line in the chart above shows a more recent resistance level at $42.53. EEM must pierce this level to sustain an uptrend.
The other potential fly in the ointment regards EEM seasonality.
Seasonality should cause traders to remain alert
The chart below displays the annual seasonal trend for the iShares MSCI Emerging Markets ETF (ticker EEM).
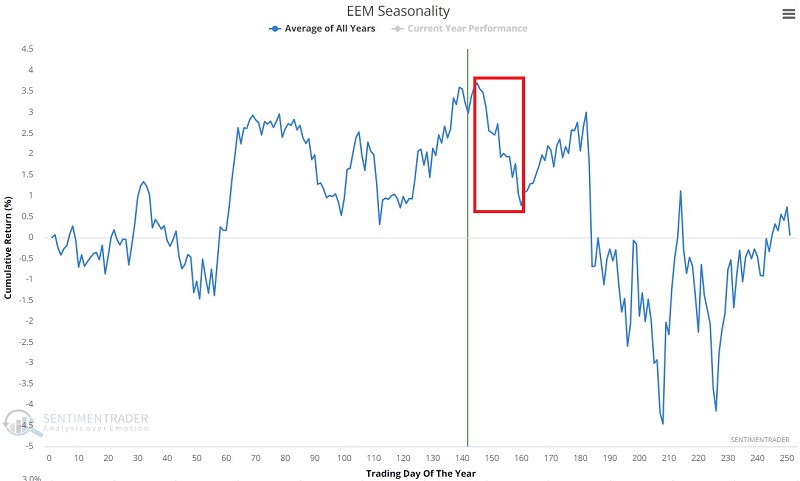
The red box highlights the period that extends from the close on Trading Day of Year #145 through TDY #160. For 2023 this period extends from the close on 2023-08-01 through the close on 2023-08-22.
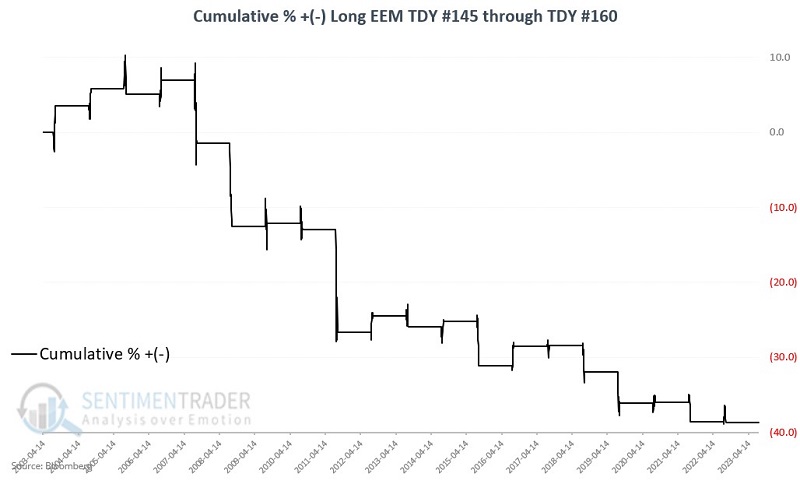
The chart below displays the hypothetical cumulative % +(-) from holding a long position in EEM only during this unfavorable period every year since 2003, when EEM started trading. The cumulative result is a loss of -38.7%.
 The table below summarizes EEM performance during this unfavorable period.
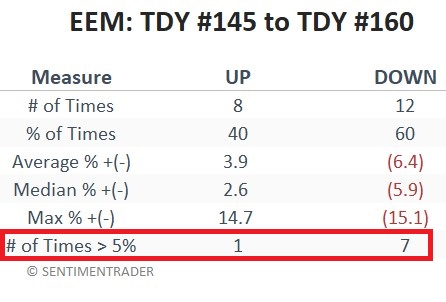
There are a few key things to note. Most importantly, a decline in EEM during this period is absolutely no sure thing (40% winners). However, the primary concern is that "when EEM is bad (within this period), it tends to be very bad." The average and median loss (-6.4% and -5.9%, respectively) are significantly greater than the average and median gain (+3.9% and +2.6%), AND there have been seven losses greater than -5% versus only one gain greater than +5%.
What the research tells us…
It is important to note that no prediction is built into this particular piece. EEM could genuinely go either way. The key point is for EEM bulls not to dig in their heels and lock themselves into a bullish mentality. If EEM fails to take out $42.53 and/or begins to falter, history clearly demonstrates that things can go south quickly and sharply. For EEM bears, the key is not to be too aggressive in fighting the current favorable trend until there is some sign of weakness/reversal. A trade involving put options on EEM might make sense at that point.