Products
SentimenTrader Trading Tools
‍
Backtest Engine
My Trading Toolkit
Correlation Analysis
Seasonality
Market Prediction
Indicators & Data API
‍
Proprietary Indicators & Charts
Market Data API
Strategies & Scanner
‍
50+ Trading Strategies
Smart Stock Scanner
Smart Option Scanner
Research Reports
‍
Research Solutions
Reports Library
Free Resources
Simple Backtest Calculator
Simple Seasonality Calculator
The Kelly Criterion Calculator
Sentiment Geo Map
Public Research Reports
Education
Sentiment Indicators
Technical Indicators
Pricing
Company
About
In the News
Testimonials
Client Success Stories
Contact
Log inLoginSign up
< BACK TO ALL REPORTS

Its time (for traders) to keep an eye on Biotech

Jay Kaeppel
2024-08-13
Biotechnology is volatile and tends toward seasonal weakness from August through October. That said, a combination of reasonable price action, a favorable sentiment signal, and an impending short-term seasonal window suggest an opportunity for nimble, aggressive traders.

Key points

  • The biotech sector has been working higher, and our XBI Optix indicator just flashed a favorable sign for biotech stocks
  • Ticker XBI is also soon entering a brief favorable seasonal period
  • This combination of factors does not guarantee a rally in the biotech sector; However, it does strongly suggest that traders be looking for an opportunity to play the long side in the months ahead

Biotech is trying to establish an uptrend

After languishing for years, the SPDR S&P Biotech ETF (ticker XBI) has been trying to establish a new uptrend. 

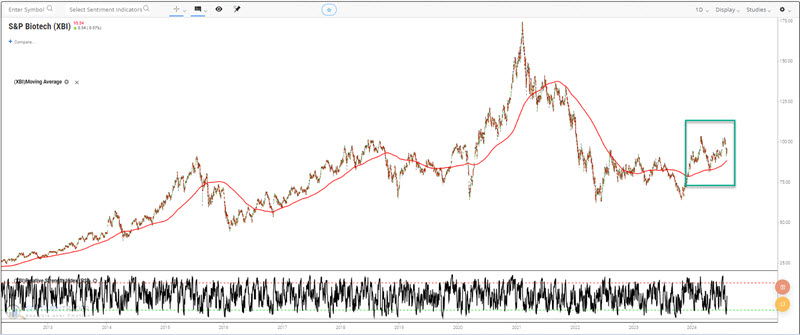
After bouncing off a long-term support level in October 2023, XBI rallied over 60% in March 2024 before pulling back in recent months. Still, the price is holding above the 200-day moving average, which is rising. Additionally, the 4-day RSI recently hit an oversold level, and the price bounced somewhat. For the moment, anyway, this is a positive configuration.

Sentiment flashes a favorable sign

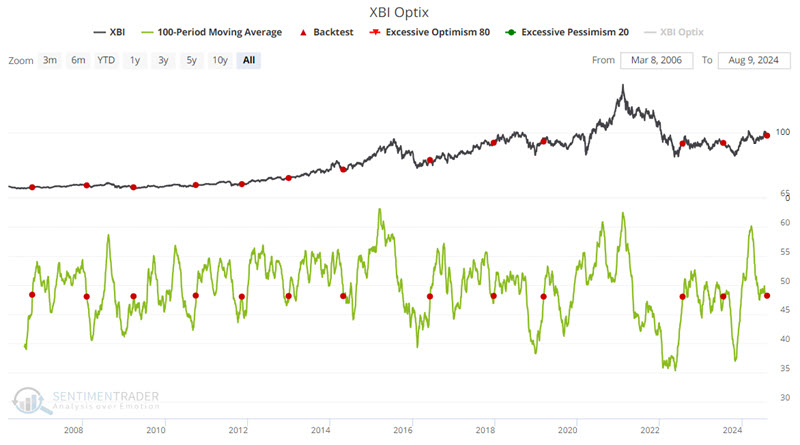
The chart below highlights those dates when the 100-day average of our XBI Optix indicator crossed above 48% for the first time in a year.

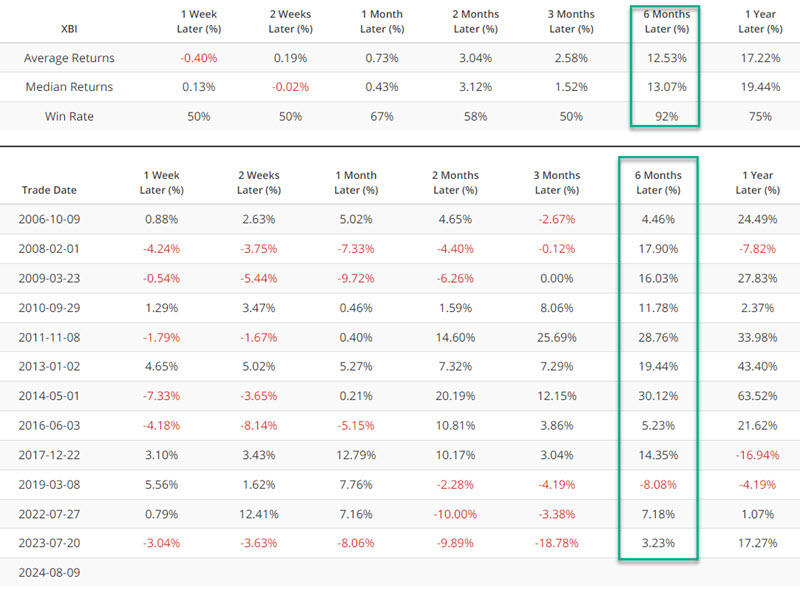
The table below shows performance has been highly favorable during the six months following previous signals.

If we eliminate the one-year between signals filter and note all crosses above 48%, we get more signals, as reflected in the chart below.

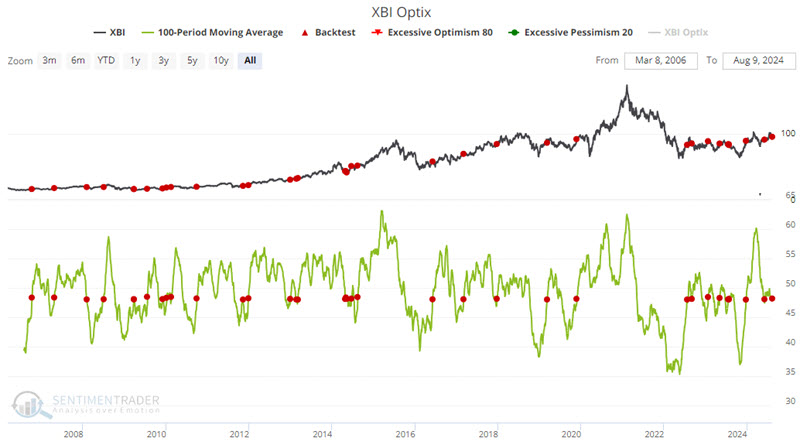
The table below summarizes the results. 

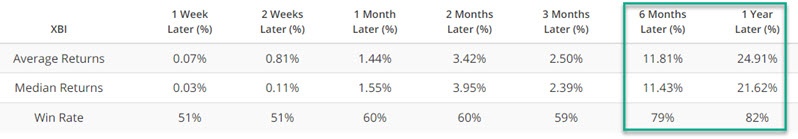
The Win Rates for six and twelve months are above average, and the 12-month Median Return is a robust 21.62%. However, before six months, returns are often quite volatile and inconsistent.

Seasonality may offer some brief help soon - but it's complicated

The chart below displays the annual seasonal trend for ticker XBI.

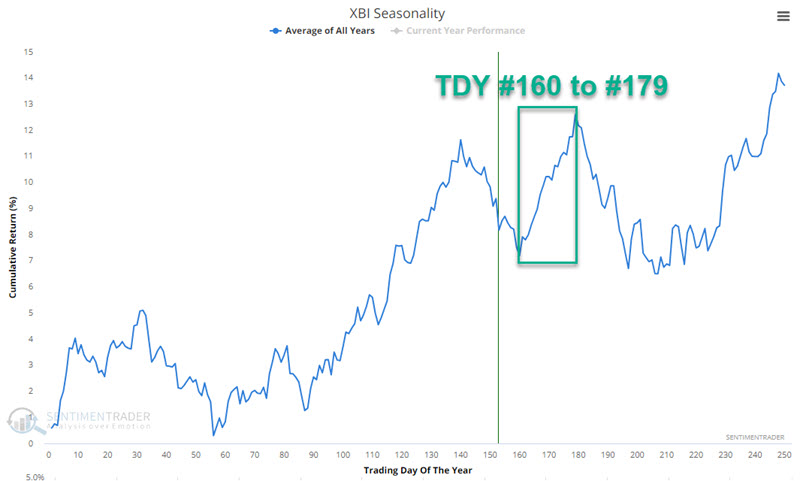
Note that a favorable period extends from Trading Day of Year (TDY) # 160 through TDY #179. For 2024, that period extends from the close on 2024-08-20 through 2024-09-17.

The chart below displays the hypothetical growth of $1 invested in XBI only during this period since 2006.

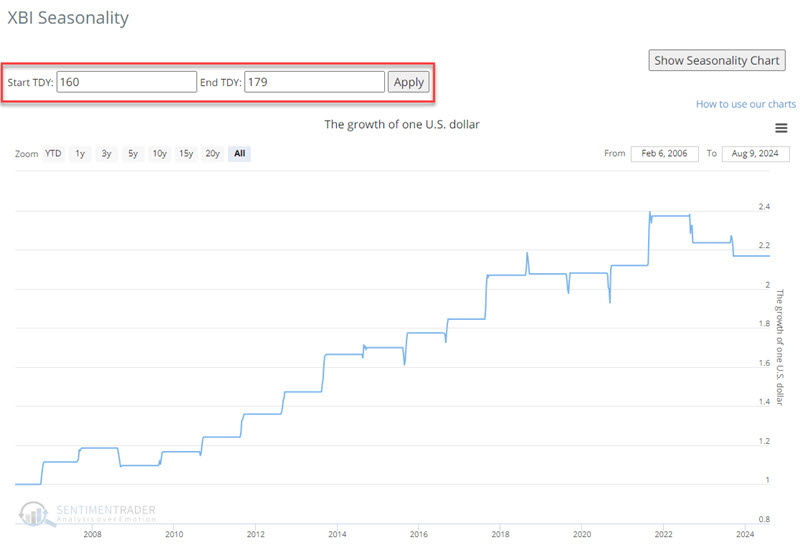
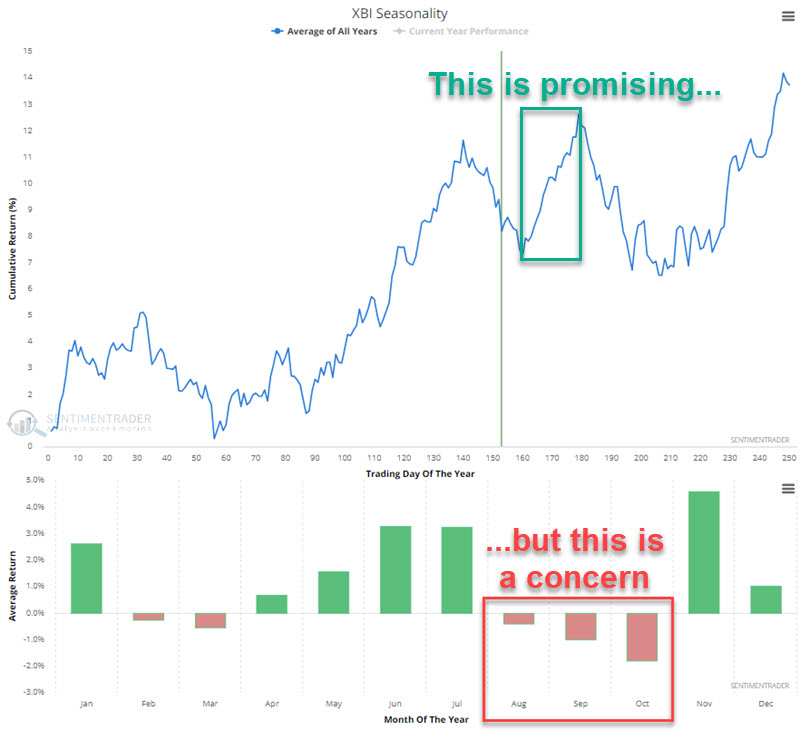
The good news is that this period has seen XBI risk 83% of the time (15 out of 18 years). Tempering this, however, is that the most recent two years were losers. Another complicating factor is that August through October tends to be the weakest part of the year overall for the biotech sector, as I recently wrote about regarding the iShares Biotechnology ETF (ticker IBB). The chart below shows the same concern applies to ticker XBI-overall seasonal weakness from August through October.


What the research tells us…

There are no sure things in the stock market, particularly in the volatile biotechnology sector. The sector has achieved much price appreciation over the years - but at the cost of hugely volatile price swings. That said, one generally accepted approach to trying to make money in stocks is to "stack" as many factors as possible in your favor. At the moment, biotech enjoys a promising trend in price action and an upswing in sentiment (from a long-term overly bearish level), and it may get at least a short-term seasonal boost from late August into mid-September. Aggressive traders may find an opportunity here. However, close attention must be paid as price action can turn quickly, and overall, biotech tends to show seasonal weakness from August through October.

PRODUCTS
SentimenTrader
Trading Tools
Indicators & Data API
‍
Strategies & Scanner
‍
Research Reports
FREE
RESOUrCES
Simple Backtest
Calculator
Simple Seasonality
Calculator
The Kelly Criterion
Calculator
Sentiment Geo Map
‍
Public Research Reports
‍
Education
Sentiment Indicators
‍
Technical Indicators
‍
Pricing
Bundle pricing
‍
FAQ
‍
Announcements
‍
COMPANY
‍
About
‍
In the News
‍
Testimonials
‍
Client Success Stories
CONTACT
‍
General Inquiries
‍
Media Inquiries
‍
Financial Professionals Inquiries
‍
© 2026 Sundial Capital Research Inc. All rights reserved.
Setsail Marketing
TermsPrivacyAffiliate Program
Risk Disclosure: The information and tools provided are for research and analytical purposes only and are not intended as investment advice. Market analysis involves uncertainty, and outcomes may differ from expectations. Users should conduct their own due diligence and consider their individual circumstances before making any financial decisions. Past performance is not necessarily indicative of future results.

Hypothetical Performance Disclosure: Hypothetical performance results have many inherent limitations, some of which are described below. No representation is being made that any account will or is likely to achieve profits or losses similar to those shown; in fact, there are frequently sharp differences between hypothetical performance results and the actual results subsequently achieved by any particular trading program. One of the limitations of hypothetical performance results is that they are generally prepared with the benefit of hindsight. In addition, hypothetical trading does not involve financial risk, and no hypothetical trading record can completely account for the impact of financial risk of actual trading. for example, the ability to withstand losses or to adhere to a particular trading program in spite of trading losses are material points which can also adversely affect actual trading results. There are numerous other factors related to the markets in general or to the implementation of any specific trading program which cannot be fully accounted for in the preparation of hypothetical performance results and all which can adversely affect trading results.

Testimonial Disclosure: Testimonials appearing on this website may not be representative of other clients or customers and is not a guarantee of future performance or success.