
It's the most small-cap time of the year

Key points:
- Small caps have entered their most favorable seasonal period of the year
- An earlier piece focused on iShares Russell 2000 ETF (IWM) during a slightly longer seasonal period since 2000
- This piece looks at the Russell 200 Index itself since 1953
Entering a seasonal period where strength tends to accelerate
The chart below displays the annual seasonal trend for the Russell 2000 Index, which comprises the 2000 smallest companies (based on cap size) in the Russell 3000 Index.
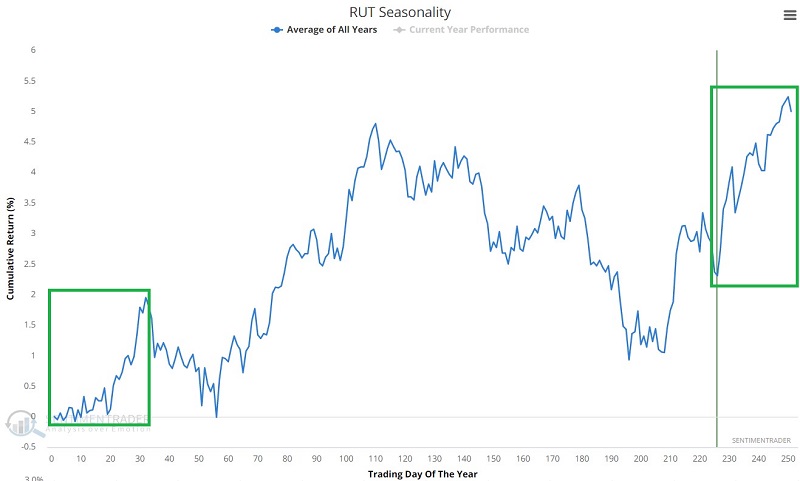
In the previously linked article, we looked at the performance of iShares Russell 2000 ETF (IWM) from Trading Day of Year #196 through TDY #32 the following year since ticker IWM started trading in 2000. For this piece, we will look at the performance of the Russell 2000 Index itself from TDY #226 through TDY #32 the following year, beginning in 1953.
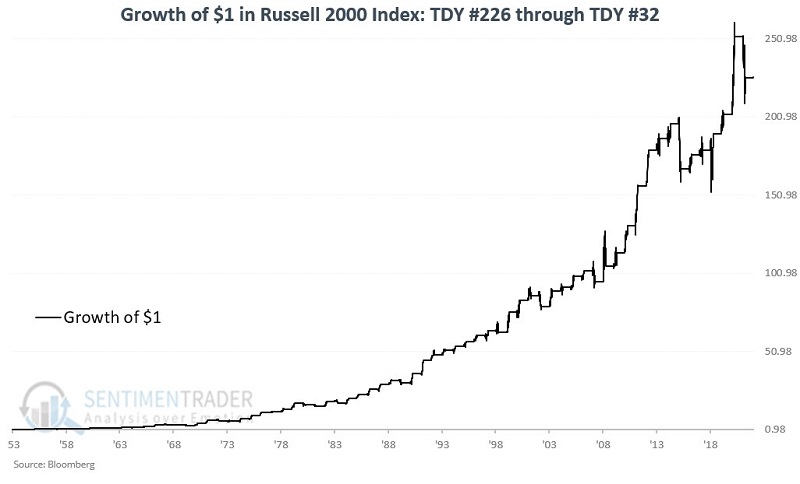
The chart below displays the cumulative % return for the Russell 2000 if held long only during TDY #226 through TDY #32 of the following year over the last 69 years.
The table below displays a summary of performance results.
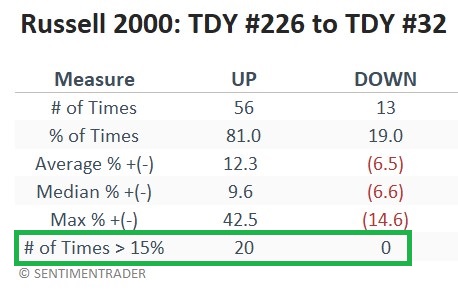
The Russell 2000 Index showed a gain during this seasonal period in roughly 4 out of every five years (81%) over the last 70 years. While there are no guarantees from year to year (the index lost -10.5% during the 2021-2022 period), that represents a high degree of dependability.
The worst decline was -14.6% in 2016. Not good. Still, there has never been a decline over -15%. On the flip side, the index has shown a gain of over +15% on 20 separate occasions. In essence, when this seasonal period is bad, it's not good, but when it's good, it's terrific.
Assessing Russell 2000 performance vs. S&P 500 Index performance
Small caps significantly underperformed large caps for the past decade. As a result, recency bias likely causes many investors to shy away from small-caps in general.
But the reality is that neither large-cap nor small-cap enjoys a permanent advantage, and the pendulum typically swings back and forth over many years. The chart below displays the performance of small-caps relative to large-caps (black line) and a 52-week moving average of this relationship. A rising black line and/or the black line above the red moving average means small caps are outperforming.
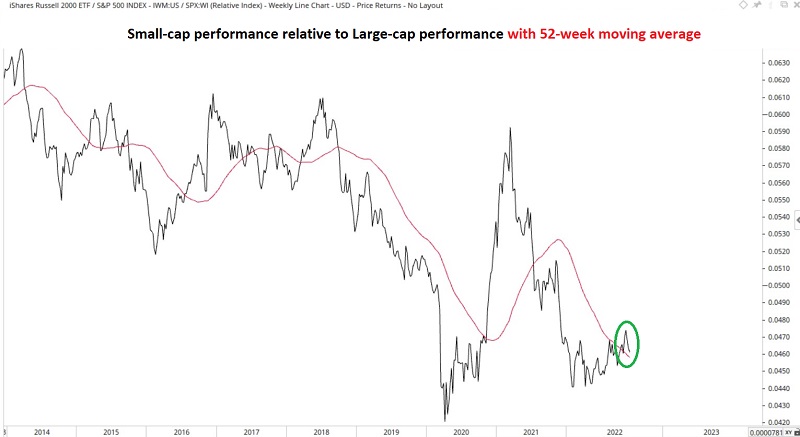
From 2014 to 2020, the overall trend significantly favored large caps. After the Covid panic low in March 2020, small caps significantly outperformed over the next year before reversing again and falling sharply relative to large caps into February 2022. The black line has been grinding higher most of this year and broke back above the 52-week average in the last month.
If the black line trends higher and the red line turns back to the upside, it will offer an important confirmation favoring small-cap stocks. If this is going to happen, the period between now and TDY #32 of 2023 is the most likely time.
What the research tells us…
After a lengthy underperformance, small-cap stocks may be poised to return to the forefront. At the moment, a confluence of potentially favorable indications may be forming. The combination of favorable seasonality and improving relative strength suggests that an opportunity is developing in the small-cap sector.