
It's not too late to look at the Industrials sector

Key points:
- The seasonal outlook for the industrials sector looks very favorable
- The sector also tends to do well during the current stretch of the election cycle
- Several breadth indicators recently flashed bullish, lending weight to the favorable seasonal outlook
Industrials shine at year-end
Industrial stocks have suddenly become a market darling, and several factors have lined up to suggest it may continue.
The broader stock market tends to show strength from the close on Trading Day of Year #226 through the end of the year. As you can see in the annual seasonal trend chart below, the Industrials sector tends to follow suit.
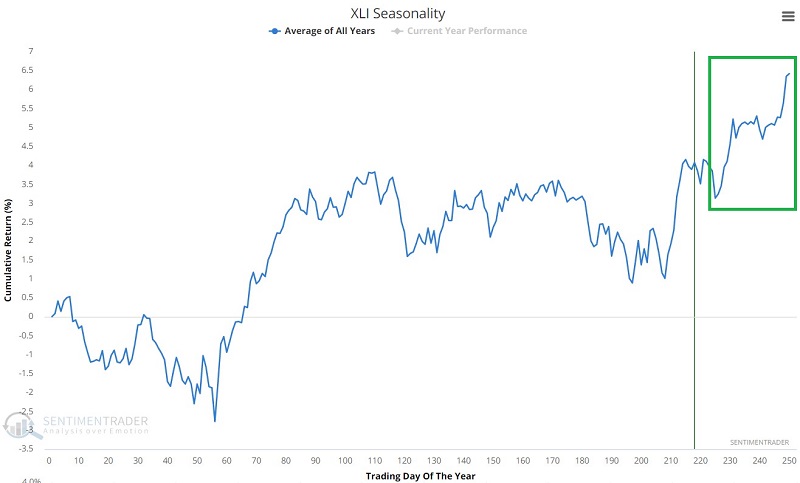
The chart below displays the performance for the Industrials sector if held only during this period every year starting in 1942.
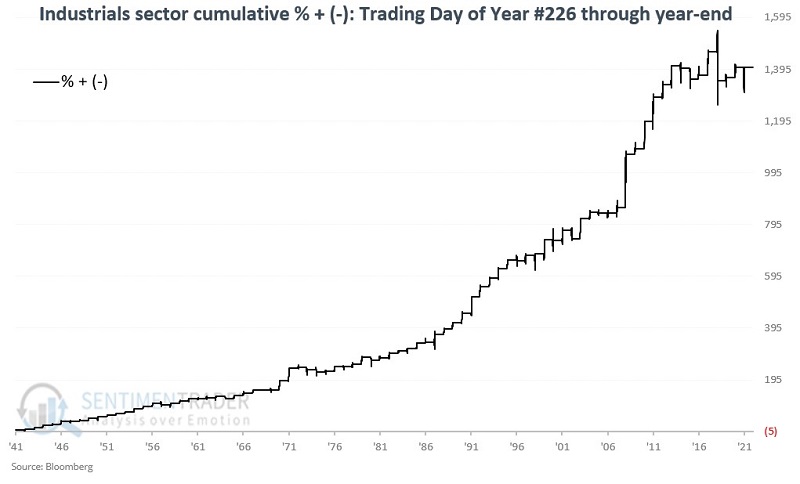
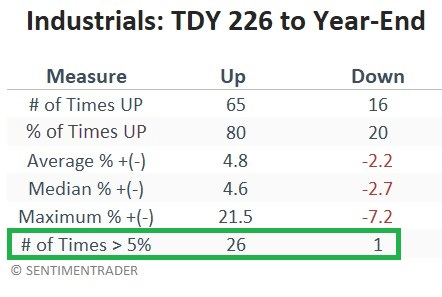
The sector showed a gain 80% of the time, with average gains about double average losses. More notably, there was a remarkable tendency to see many more large gains than large losses.
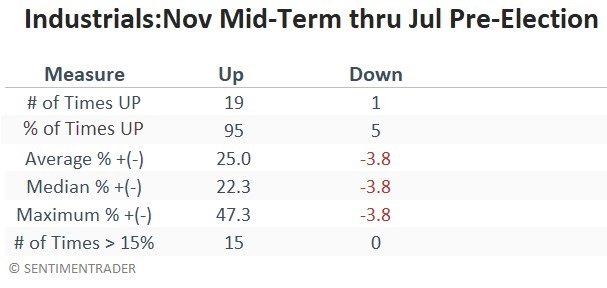
The heart of the election cycle is a strong period for Industrials
As discussed in this article, the most favorable ten months of the 48-month election cycle extend from November 1st of the mid-term year through July of the pre-election year. The Industrials sector has shown remarkable consistency during this period.
The chart below shows the performance for the Industrials sector if held only during these ten months every four years starting in 1942.
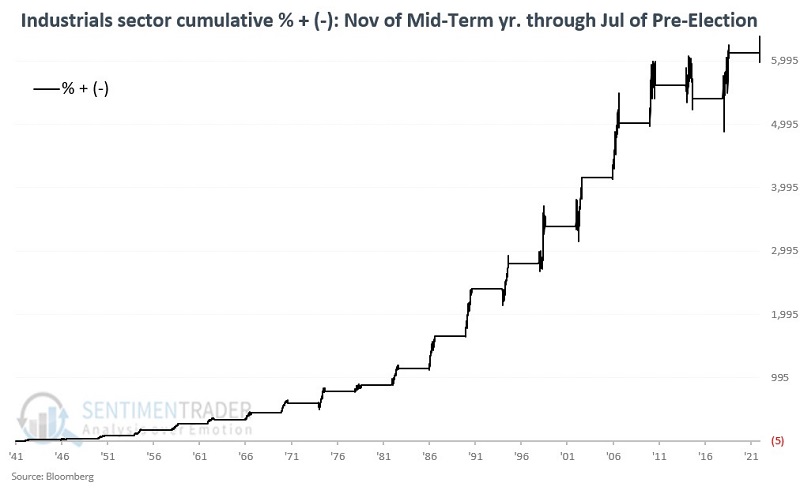
Industrials rallied during 19 out of 20 cycles, scoring impressive gains most of the time.
Breadth indicators have already flashed green
Relying solely on seasonal trends to trade requires a leap of faith. Typically, it is best to combine seasonality with information from other indicators to make the odds as favorable as possible. Fortunately, several breadth indicators confirm favorable signals for the Industrials sector in the months ahead, as Jason noted at the end of October.
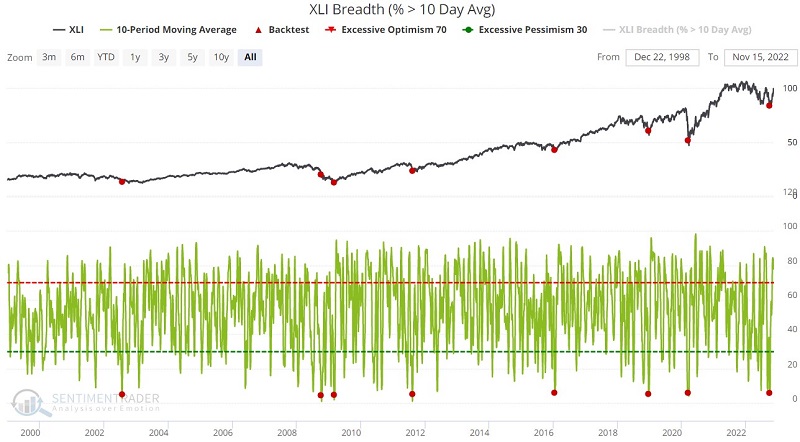
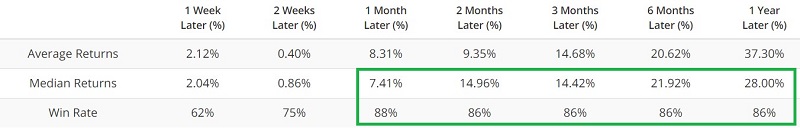
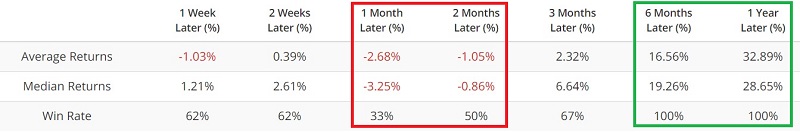
The chart below displays when the 10-day moving average of the XLI Breath (% > 10-day avg) indicator crossed below 6%. Over the medium- to long-term, XLI averaged excellent gains.
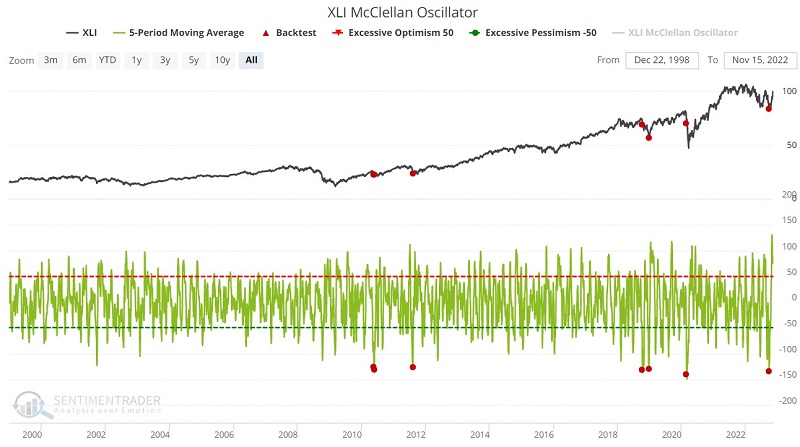
The chart below shows when the 5-day moving average of the XLI McClellan Oscillator Breath indicator crossed below -125. While the sample size is quite small and restricted to the past decade, there were no losses over the next 6-12 months.
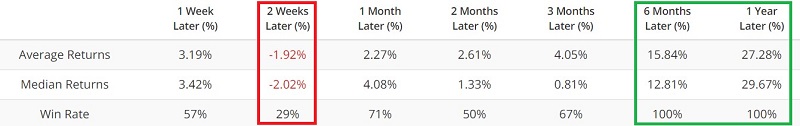
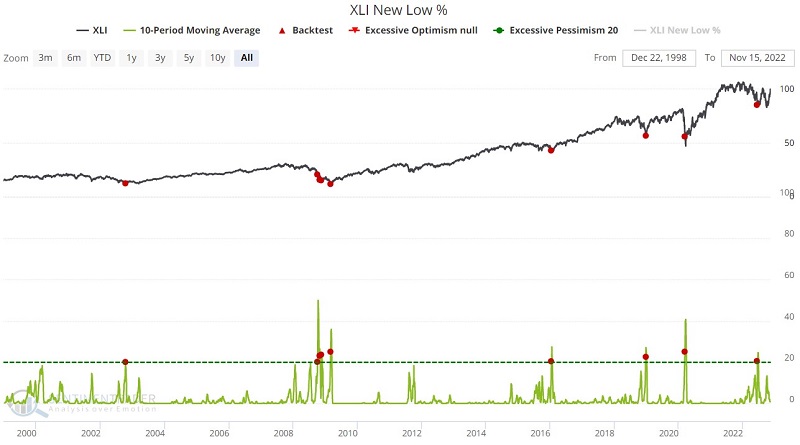
The chart below highlights when the 10-day moving average of the XLI % New Low indicator crossed above 20%. Once again, there were few losses after the very short-term. Virtually all of the signals triggered at or near the ends of bear markets.
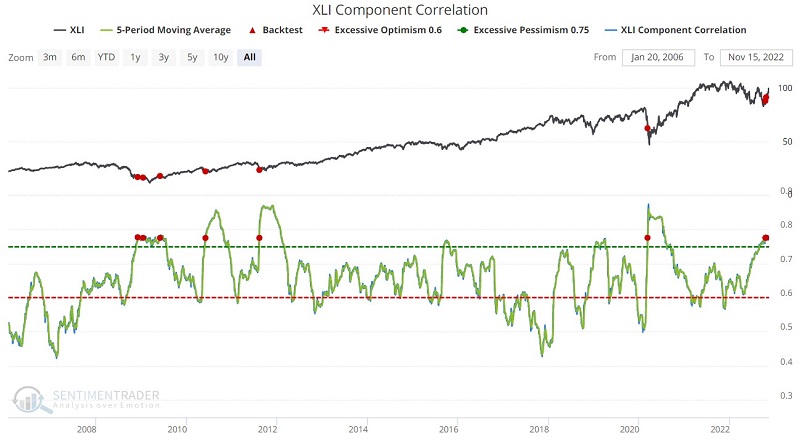
Component correlation measures the degree to which the stocks in the sector are moving in tandem. Typically, high readings occur near bottoms as investors dump stocks in a given sector indiscriminately.
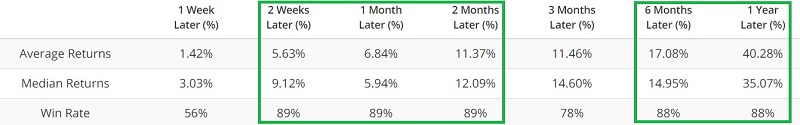
The chart below displays those days when the 5-day moving average of the XLI Component Correlation indicator crossed above 0.78. After other times investors panicked en masse, XLI suffered some in the shorter-term, but exhibited excellent long-term returns.
What the research tells us…
The seasonal outlook for the Industrials sector is highly favorable, and seasonal trends sometimes work surprisingly well as a standalone indicator. However, relying solely on seasonality is rarely a good idea because there is no way to predict whether a given seasonal trend will work the next time around.
As a result, it is best to combine seasonal trends with other confirming indicators. We have many historically favorable signals from an array of breath indicators that appear to confirm an optimistic outlook for Industrials into the middle of next year.