Products
SentimenTrader Trading Tools
‍
Backtest Engine
My Trading Toolkit
Correlation Analysis
Seasonality
Indicators & Data API
‍
Proprietary Indicators & Charts
Market Data API
Strategies & Scanner
‍
50+ Trading Strategies
Smart Stock Scanner
Research Reports
‍
Research Solutions
Reports Library
Free Resources
Simple Backtest Calculator
Simple Seasonality Calculator
The Kelly Criterion Calculator
Sentiment Geo Map
Public Research Reports
Pricing
Company
About
In the News
Testimonials
Client Success Stories
Contact
Log inLoginSign up
< BACK TO ALL REPORTS

It's not too late for health care

Jay Kaeppel
2021-12-27
The health care sector suffered a short, sharp dip during September into early October, reaching a significantly oversold condition as a result. Since then, health care has been a top-performing sector even during the recent overall market weakness. More importantly, if history proves an accurate guide, the advance may have plenty of room to run.

Key Points

  • When the health care sector reaches a certain level of oversold, it typically sets up a decent buying opportunity, often followed by an extended advance.
  • Following a simple rule may be enough to alert investors to this type of opportunity

XLV Breadth Signal

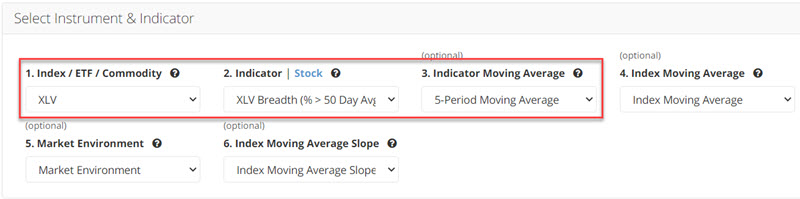
Let's consider the potential for using a simple breadth-based indicator to play the long side using shares of ETF XLV (Health Care Select Sector SPDR Fund). The rule we will use is:

  • The 5-day average for SPY Breadth (% > 50 Day Avg) crosses above 12%

The input screens appear in the screenshots below. You can run this test in the Backtest Engine.

The Signals

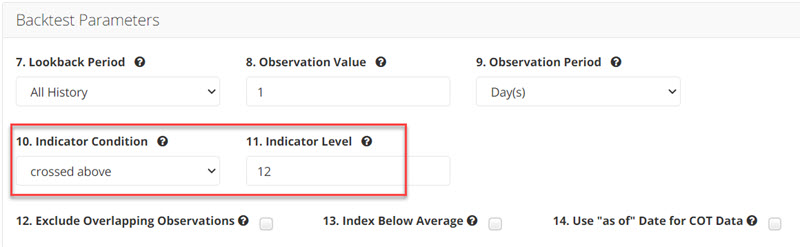
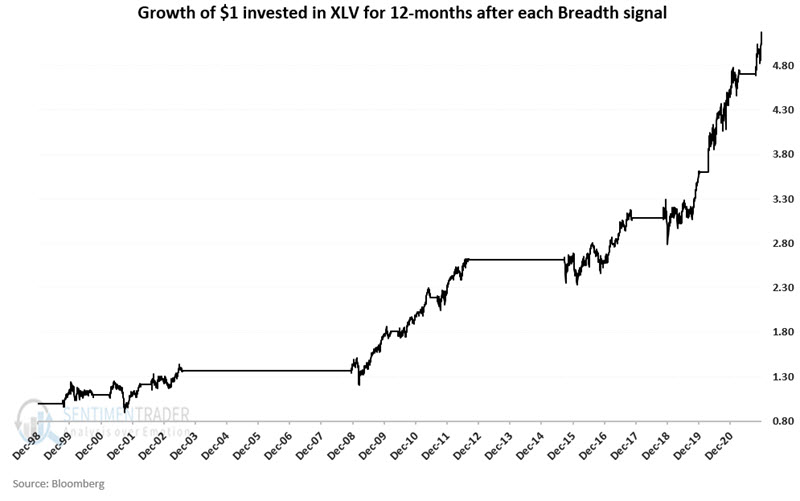
The signals generated by the rule above appear in the chart below.

The chart below displays the growth of $1 invested in XLV for twelve months after each signal (including overlaps; i.e., if a new signal occurs within 12-months of a previous signal, the holding period is extended another 12 months).

The table below displays the cumulative % return for XLV during each "invested" period (including overlaps).

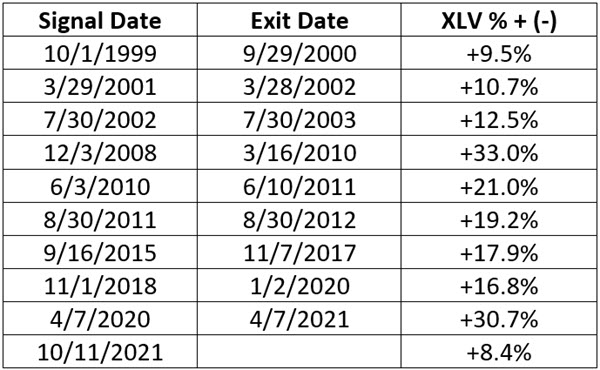
The average % gain has been +19.0%, and the median gain +17.9%

Now what?

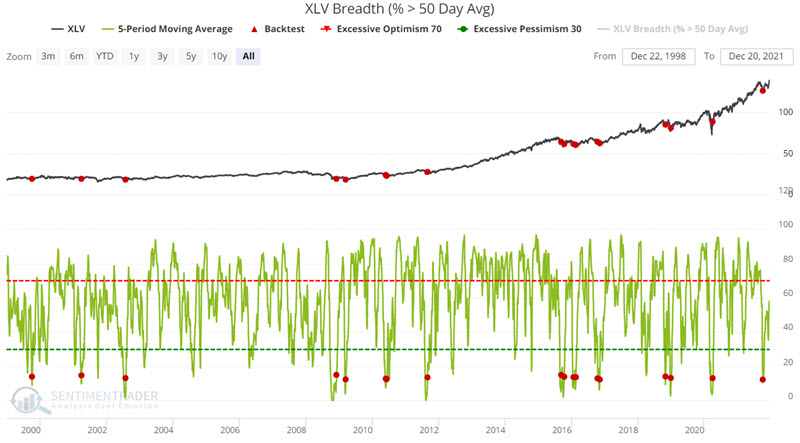
The most recent signal occurred on 10/11/2021. Since that time, XLV has gained over +8%. Is it too late to get in? History suggests that the answer is "no." The table below displays the % return for XLV:

  1. Two months after each previous signal
  2. 12 months after each previous signal
  3. And the % gain or loss if an investor had entered two months after each signal and held for ten months

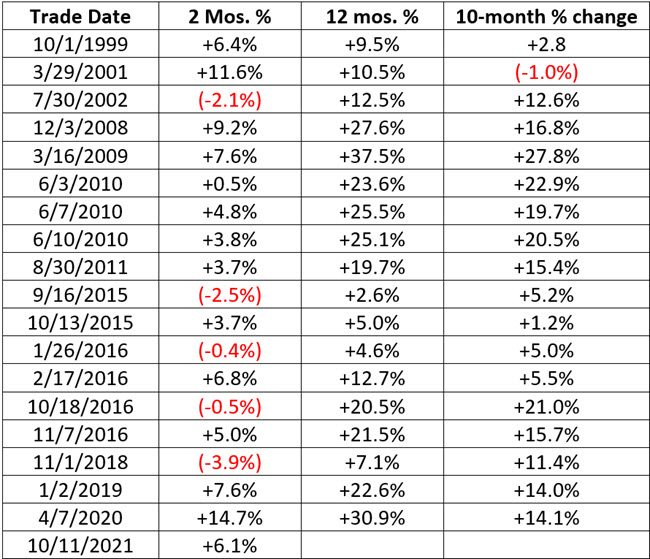
The period between 2 months and 12 months showed a gain 16 out of 17 times (94%), with a median 10-month gain of +14.0%.

What the research tells us:

Rallies in the health care sector tend to play out over time and reward patient investors. One key advantage to this tendency is that investors who are "late to the game" can often still enjoy the benefits of these extended rallies. The October signal from our Optix indicator does not mean that it is smooth sailing for health care sector investors this time around. But history suggests that the odds are favorable.

Sorry, you don't have access to this report

Upgrade your subscription plan to get access
Go to Dasboard
PRODUCTS
SentimenTrader
Trading Tools
Indicators & Data API
‍
Strategies & Scanner
‍
Research Reports
FREE
RESOUrCES
Simple Backtest
Calculator
Simple Seasonality
Calculator
The Kelly Criterion
Calculator
Sentiment Geo Map
‍
Public Research Reports
‍
Pricing
Bundle pricing
‍
Announcements
‍
FAQ
COMPANY
‍
About
‍
In the News
‍
Testimonials
‍
Client Success Stories
CONTACT
‍
General Inquiries
‍
Media Inquiries
‍
Financial Professionals Inquiries
‍
© 2025 Sundial Capital Research Inc. All rights reserved.
Setsail Marketing
TermsPrivacyAffiliate Program
Risk Disclosure: Futures and forex trading contains substantial risk and is not for every investor. An investor could potentially lose all or more than the initial investment. Risk capital is money that can be lost without jeopardizing ones’ financial security or life style. Only risk capital should be used for trading and only those with sufficient risk capital should consider trading. Past performance is not necessarily indicative of future results.

Hypothetical Performance Disclosure: Hypothetical performance results have many inherent limitations, some of which are described below. No representation is being made that any account will or is likely to achieve profits or losses similar to those shown; in fact, there are frequently sharp differences between hypothetical performance results and the actual results subsequently achieved by any particular trading program. One of the limitations of hypothetical performance results is that they are generally prepared with the benefit of hindsight. In addition, hypothetical trading does not involve financial risk, and no hypothetical trading record can completely account for the impact of financial risk of actual trading. for example, the ability to withstand losses or to adhere to a particular trading program in spite of trading losses are material points which can also adversely affect actual trading results. There are numerous other factors related to the markets in general or to the implementation of any specific trading program which cannot be fully accounted for in the preparation of hypothetical performance results and all which can adversely affect trading results.

Testimonial Disclosure: Testimonials appearing on this website may not be representative of other clients or customers and is not a guarantee of future performance or success.