
It's not the time to chase high-yield bonds

Key Points
- High-yield bonds have rallied nicely off the April 2025 low and are in an established uptrend
- However, high-yield bonds are about to enter a seasonal period of historically consistent price weakness
- Ticker HYG is an ETF that tracks a portfolio of high-yield corporate bonds
- While shorting HYG is possible, the real message may be to avoid allocating capital to high-yield bonds until this period has passed
The overall trend for high-yield bonds remains favorable
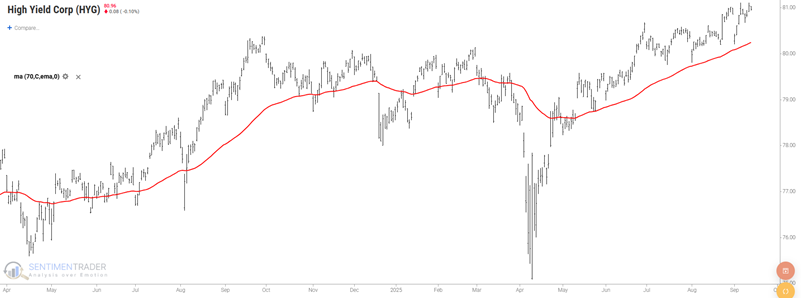
The chart below shows that the iShares iBoxx $ High Yield Corporate Bond ETF (HYG) is trading in an uptrend, well off the April lows and firmly above its 70-day exponential.
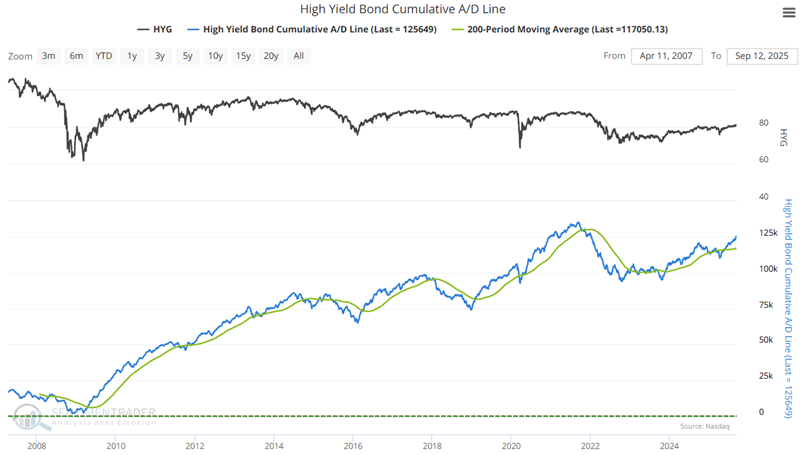
Two other confirmation indicators are also currently reflecting strength in the high-yield sector. The High-Yield Cumulative A/D Line is trending higher above its 200-day moving average.
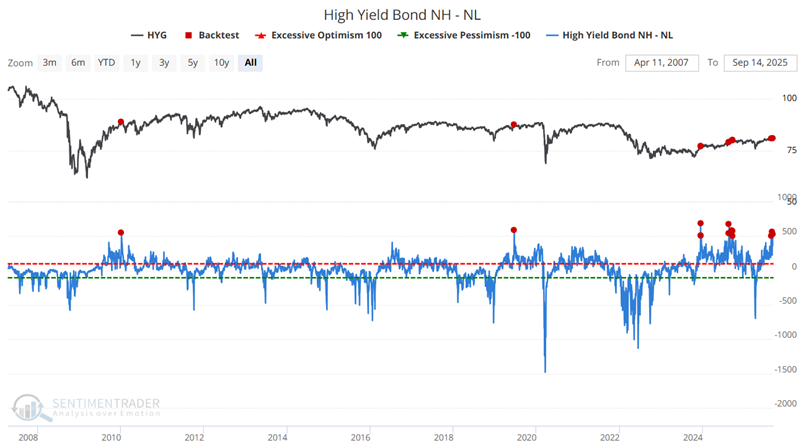
The High-Yield Bond NH-NL is above +500. While this indicates current strength in the high-yield sector, there is a history of short-term weakness following readings of +500 or more. This dovetails with the upcoming unfavorable seasonal period, which we will highlight next.
This should not be viewed as a "sell short" signal but as a "hold off on new commitments" signal.
Early Fall HYG weakness has been pretty consistent
High-yield corporate bond price movements correlate much more closely with stock prices (0.75) than treasury bonds (0.24). Stock prices tend to move based on overall economic fundamentals, while treasury bonds are a pure play on interest rates. High-yield bond fundamentals are more attuned to the economy and factors that impact overall business conditions than to changes in interest rates. Poor economic conditions can lead to a higher default rate for debt securities issued by lower-rated companies.
In addition to macro factors, high-yield bonds tend to show intra-year seasonal patterns. Our Annual Seasonal Trend charts show the average yearly performance over many years. As always, they represent an average of what has occurred in the past and are not a "roadmap" to what will happen in any given year.
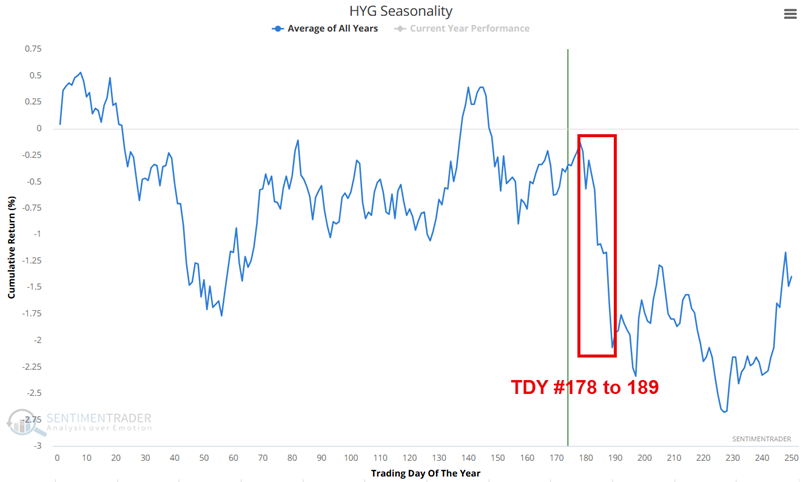
The blue line in the chart below shows the ticker HYG's Annual Seasonal Trend, and the red line represents HYG's price action for this year.
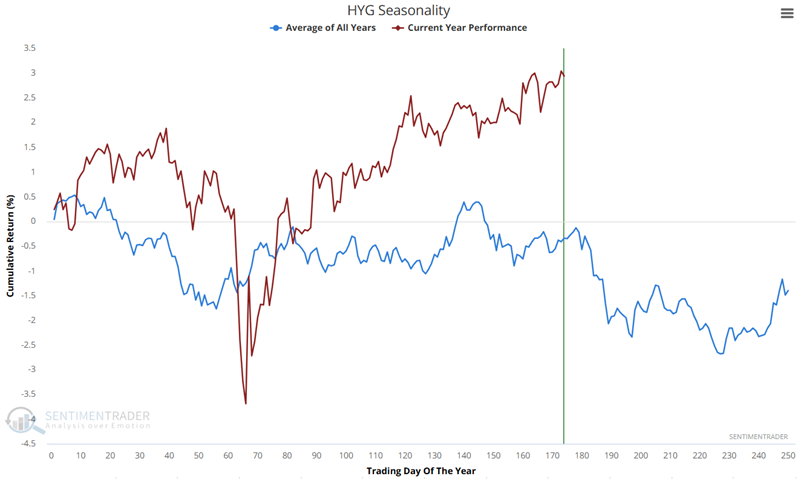
In the chart below, we note that a period of typical seasonal weakness extends from the close on Trading Day of the Year (TDY) #178 through TDY #189. For 2025, this period extends from the close of September 18th through October 3rd.
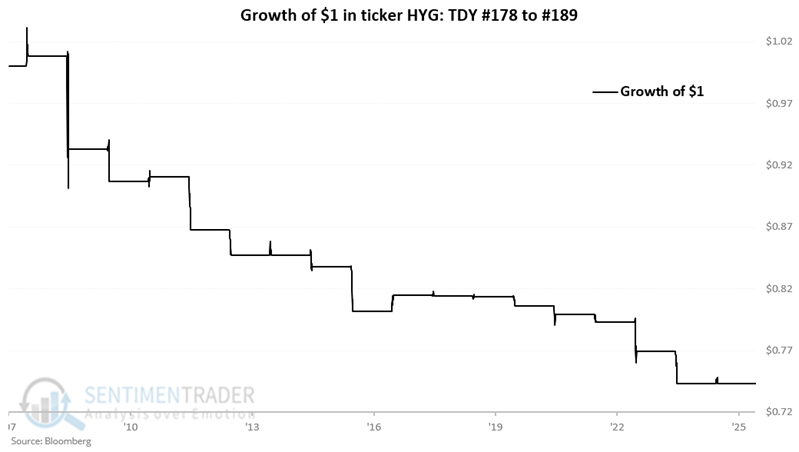
The chart below displays the hypothetical growth of $1 invested in HYG held long only during the Trading Day of Year #178 through TDY #189 since 2007.
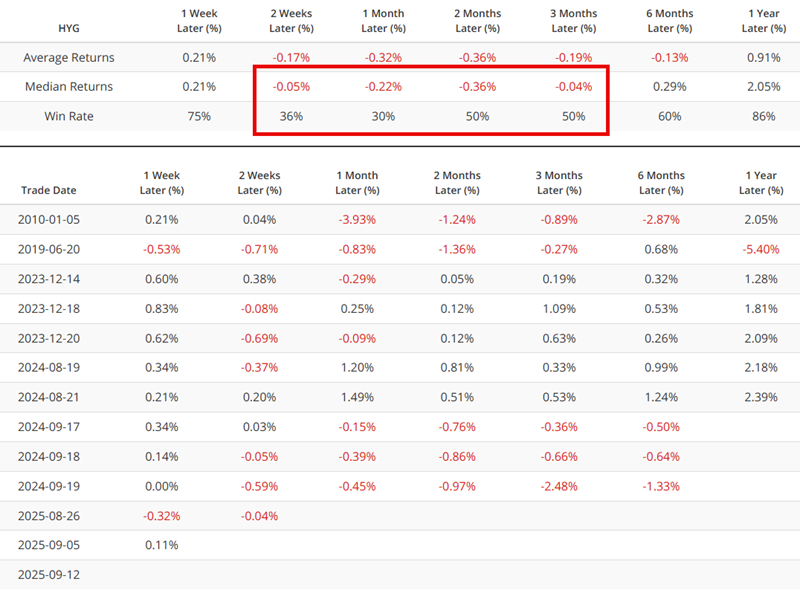
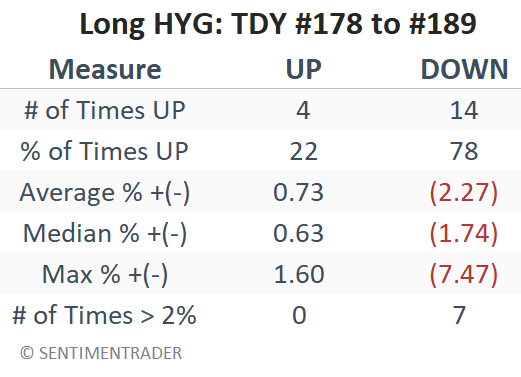
The table below summarizes HYG's performance only during this period since it started trading in 2007. Note that 2%+ moves have skewed negatively by a factor of 7 to 0.
On some occasions, the implication of a given seasonal trend is to hold a long position if the seasonal trend is favorable or a short position if the seasonal trend is unfavorable. In this case, however, the problem is more the decline consistency than the average and median decline size. For that reason, a short position in HYG is not the recommendation. The primary point is to hold off on any new buying until the end of the seasonal period, and to look at any decline between now and then as a potential buying opportunity.
What the research tells us…
The current favorable trend in high-yield bonds and the short-term nature of the impending unfavorable period suggest that the play in high-yield bonds is to look for an opportunity to use weakness in the weeks ahead as a buying opportunity.