
It may be time to seek healthcare

Key points
- Several positive factors are coming together for the healthcare sector
- The sector recently became oversold within an established uptrend
- Likewise, insider selling has plunged, and seasonality will soon be quite favorable
Some green lights for healthcare
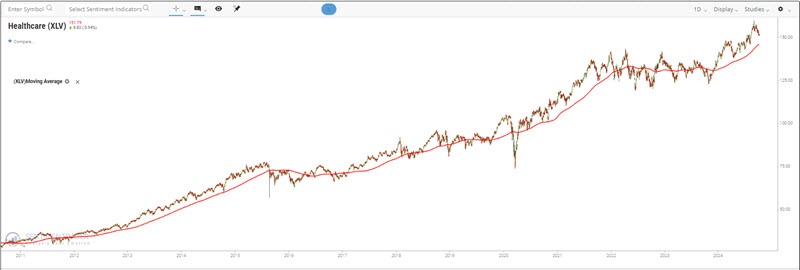
Over the very long term, the healthcare sector has been a top - and relatively consistent - performer. More recently, the sector has surged 25% over the last year after trending sideways for almost two and a half years. While interpreting chart patterns is not our "thing," the chart below suggests a classic case of a sector "pulling back within the context of a larger uptrend." At least, that is the hope.
Will the healthcare sector rebound and head higher? There are several reasons to give the bullish case the benefit of the doubt.
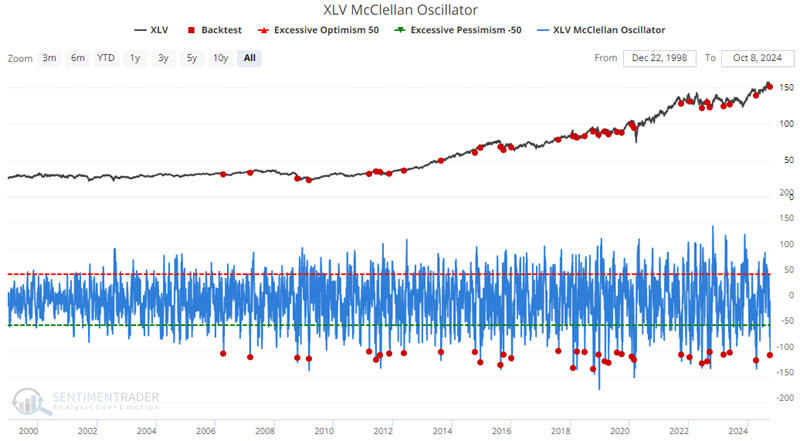
The XLV McClellan Oscillator reaches oversold
The Oscillator is based on work pioneered by Sherman and Marian McClellan and is currently carried on by their son Tom (search the web for "McClellan Oscillator" for more background). It looks at the momentum of the underlying breadth of the market. When it is above zero, momentum is positive; below zero, it is negative. It also works as an overbought/oversold indicator when it pushes above +100 or below -100 respectively.
The chart below highlights those dates when the Health Care Select Sector SPDR Fund (ticker XLV) McClellan Oscillator crossed below -100 for the first time in a month.
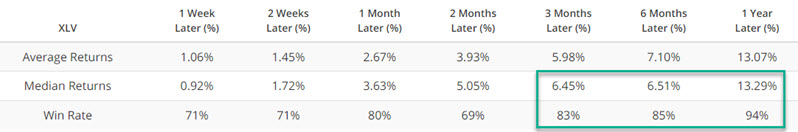
The table below summarizes subsequent XLV performance.
For the sake of comparison, the table below displays XLV performance for all trading days since 1999.
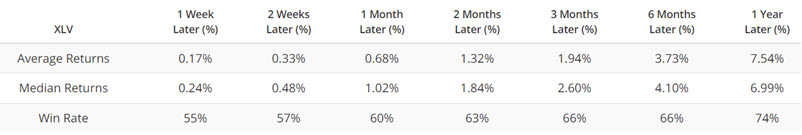
As you can see, the sector tends to perform better following an oversold reading from the XLV McClellan Oscillator.
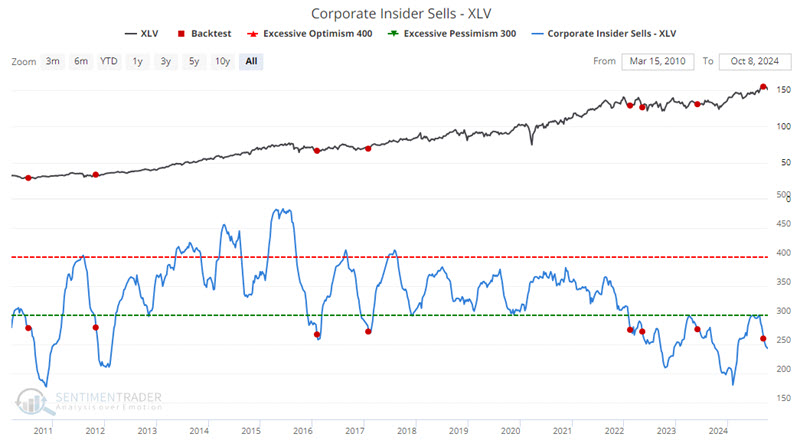
Corporate insider selling has plunged again
The bad news is that insider buying in the healthcare sector has declined significantly over the last year. However, this is typical - i.e., insiders tend to accumulate shares when they think the industry is undervalued rather than on a trend-following basis. The good news is that insider selling has plunged recently. This suggests that healthcare sector insiders still see further upside potential and are presently in "Hold" mode.
The chart below highlights the dates when our Corporate Insider Sells-XLV indicator crossed below 280. The most recent signal occurred on 2024-09-09. This indicator shows the total number of corporate insiders of companies covered by the XLV ETF who have sold shares on the open market during the past six months.
The table below summarizes subsequent XLV performance.
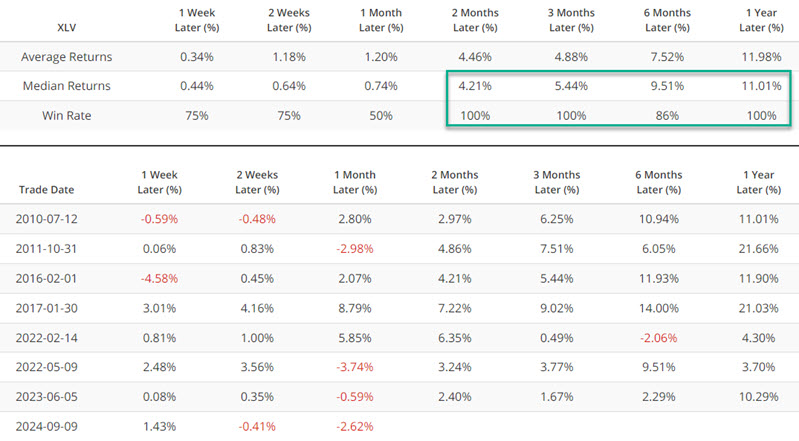
While the Median Returns are not spectacular, the high Win Rates may give investors some confidence in holding this sector in the year ahead.
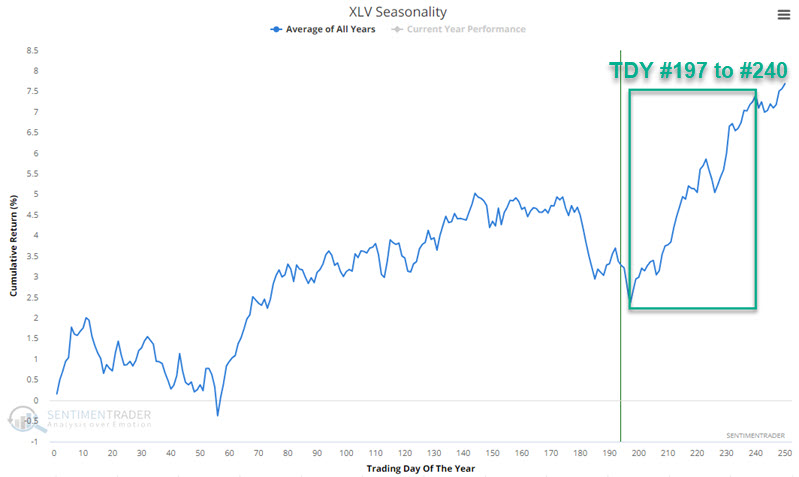
Seasonality will soon enter a favorable period
First, the usual caveat is that seasonality is merely an average of historical annual performance and NOT a roadmap to what will happen during the current year. With that said, the chart below shows that the annual seasonal trend for ticker XLV will soon be entering arguably the most favorable time of year. For 2024, this period extends from 2024-10-11 through 2024-12-12.
The chart below displays the hypothetical growth of $1 invested in the S&P 500 Healthcare Sector Index (the index that XLV attempts to track) only during this period, starting in 1953.
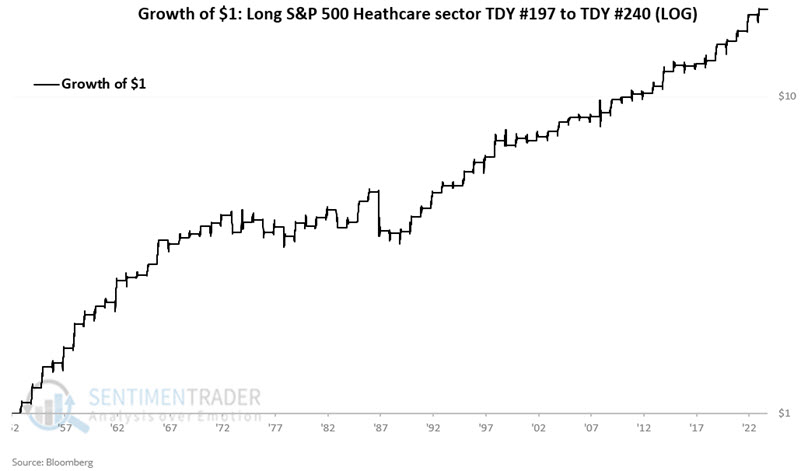
The table below summarizes the S&P 500 healthcare sector performance during this period since 1953.
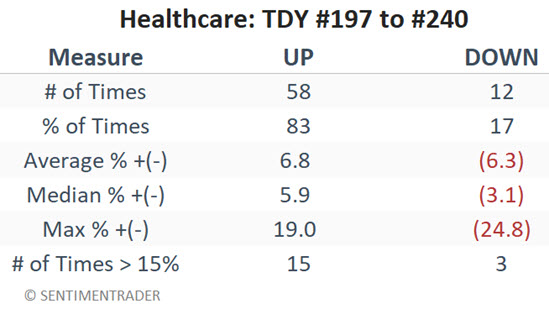
Note that during this "supposedly favorable" period, this sector lost -24.8%, -12.2%, and -11.8% in 2008, 1983, and 1973, respectively. So, remember that there is always risk involved in investing. That said, overall, performance results skew heavily to the positive side, lending solid weight to the favorable side of the weight of the evidence ledger.
What the research tells us…
The stars seem to be aligning for the healthcare sector. When we combine an oversold pullback in an established uptrend, a favorable outlook from corporate insiders (who are steadfastly holding the bulk of their shares that they purchased heavily last year), and an extremely favorable seasonal trend, it is only natural to hold a positive outlook. Whether the market will actually follow through and reward investors remains to be seen. But for now, the healthcare sector looks like a decent place to allocate capital.