Products
SentimenTrader Trading Tools
‍
Backtest Engine
My Trading Toolkit
Correlation Analysis
Seasonality
Market Prediction
Indicators & Data API
‍
Proprietary Indicators & Charts
Market Data API
Strategies & Scanner
‍
50+ Trading Strategies
Smart Stock Scanner
Smart Option Scanner
Research Reports
‍
Research Solutions
Reports Library
Free Resources
Simple Backtest Calculator
Simple Seasonality Calculator
The Kelly Criterion Calculator
Sentiment Geo Map
Public Research Reports
Education
Sentiment Indicators
Technical Indicators
Pricing
Company
About
In the News
Testimonials
Client Success Stories
Contact
Log inLoginSign up
< BACK TO ALL REPORTS

It may be time for an attitude adjustment in soybeans

Jay Kaeppel
2024-10-03
Soybeans have been pounded hard over the past two-and-a-half years. Is it time to start looking for a potential reversal? History offers a possible answer, as we detail herein.

Key points

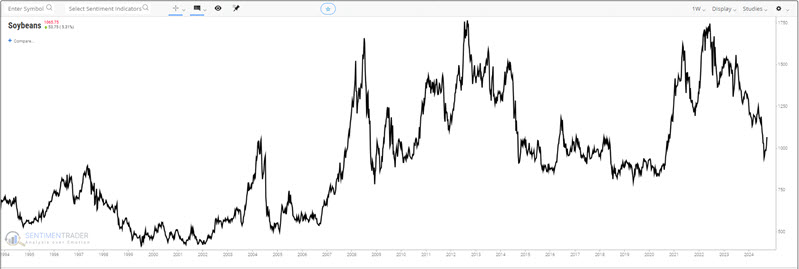
  • Soybeans have experienced extreme price weakness in recent years
  • Beans declined over -22% from May into August of 2024 and over -45% over the last two and a half years
  • That said, the annual seasonal trend for soybeans now suggests that the worst may be over and that traders should start to look for opportunities to play the long side of this highly cyclical market

Seasonality suggests the worst may be behind us

The chart below displays a long-term chart of price action for soybean futures.

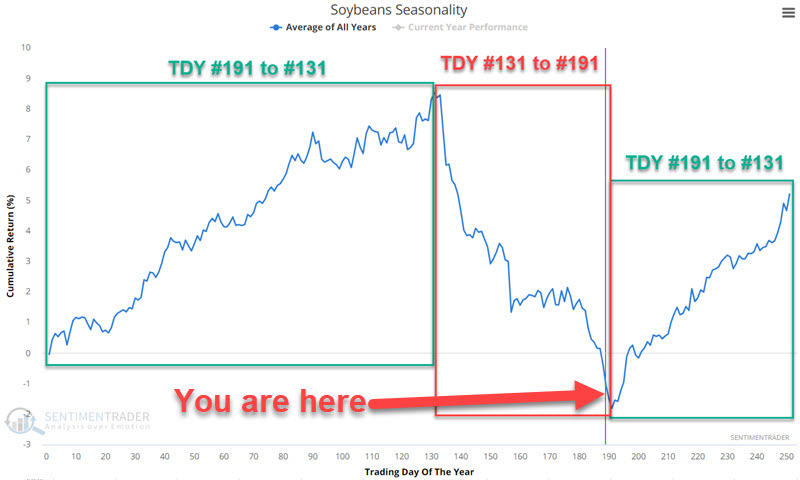
The chart below displays the annual seasonal trend for soybean futures. Note that there are essentially two distinct periods:

  • Favorable from Trading Day of Year (TDY) #191 to TDY #131 of the following year
  • Unfavorable from TDY #131 to TDY #191

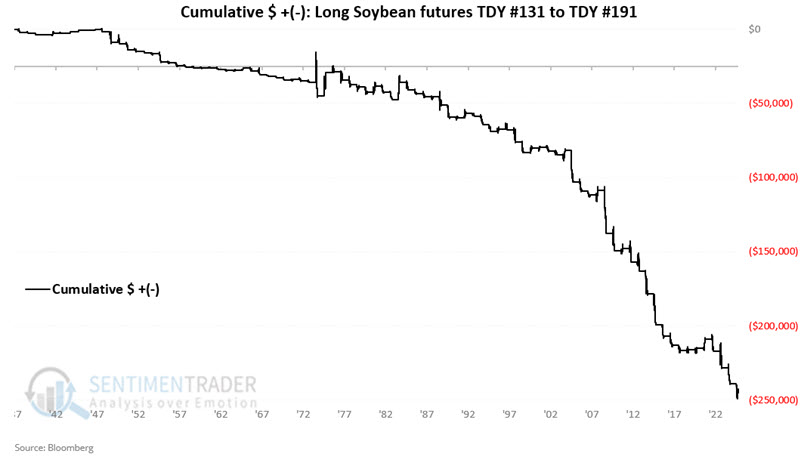
The most recent unfavorable period ends at the close on 2024-10-03. The chart below displays the hypothetical $+(-) achieved by holding a long position in soybean futures only during the unfavorable TDY #131 to TDY #191 period, every year starting in 1937. 

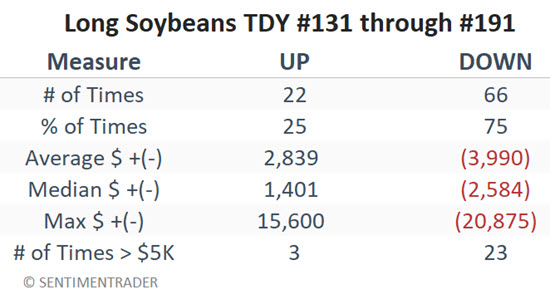
The table below summarizes annual results during unfavorable periods.

Transitioning to a favorable period

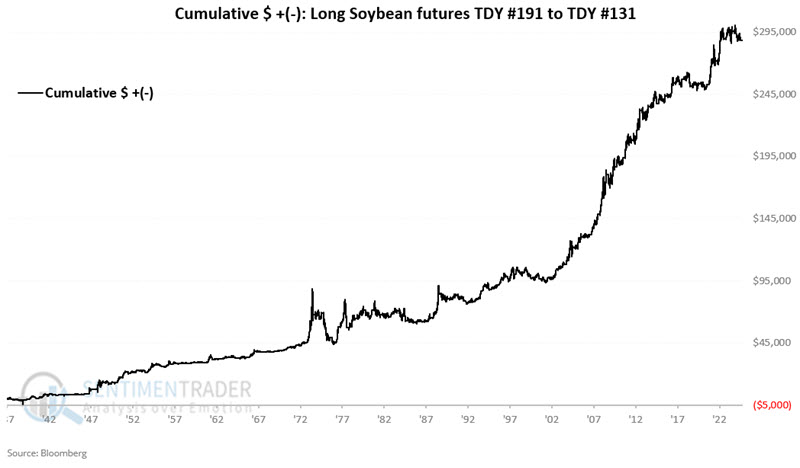
As we saw in the seasonality chart above, a favorable seasonal period begins at the close of TDY #191 and extends through TDY #131 of the following year. This new favorable period starts at the close on 2024-10-03.

The chart below displays the hypothetical $+(-) achieved by holding a long position in soybean futures only during the favorable TDY #191 to TDY #131 period, every year starting in 1937. 

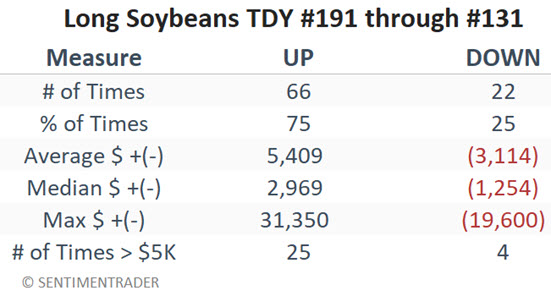
The table below summarizes annual results during favorable periods.

An ETF alternative for non-futures traders

Traders who wish to play the soybean market but do not want to trade futures contracts can buy shares of the Teucrium Soybean Fund ETF (ticker SOYB) just as they would buy shares of any stock or ETF. The key difference is the lack of leverage and the elimination of the unlimited risk associated with futures trading. 

What the research tells us…

So, are soybeans destined to rise sharply higher starting on October 4th? Not necessarily. As always, it is essential to remember that seasonality is not a roadmap, only an average of what has happened in the past. That said, the message right now regarding soybean seasonality is two-fold: 1) Traders playing the short side should consider taking profits or maintaining a relatively tight trailing stop, and 2) Traders should now start looking for opportunities to play the long side.

PRODUCTS
SentimenTrader
Trading Tools
Indicators & Data API
‍
Strategies & Scanner
‍
Research Reports
FREE
RESOUrCES
Simple Backtest
Calculator
Simple Seasonality
Calculator
The Kelly Criterion
Calculator
Sentiment Geo Map
‍
Public Research Reports
‍
Education
Sentiment Indicators
‍
Technical Indicators
‍
Pricing
Bundle pricing
‍
FAQ
‍
Announcements
‍
COMPANY
‍
About
‍
In the News
‍
Testimonials
‍
Client Success Stories
CONTACT
‍
General Inquiries
‍
Media Inquiries
‍
Financial Professionals Inquiries
‍
© 2026 Sundial Capital Research Inc. All rights reserved.
Setsail Marketing
TermsPrivacyAffiliate Program
Risk Disclosure: The information and tools provided are for research and analytical purposes only and are not intended as investment advice. Market analysis involves uncertainty, and outcomes may differ from expectations. Users should conduct their own due diligence and consider their individual circumstances before making any financial decisions. Past performance is not necessarily indicative of future results.

Hypothetical Performance Disclosure: Hypothetical performance results have many inherent limitations, some of which are described below. No representation is being made that any account will or is likely to achieve profits or losses similar to those shown; in fact, there are frequently sharp differences between hypothetical performance results and the actual results subsequently achieved by any particular trading program. One of the limitations of hypothetical performance results is that they are generally prepared with the benefit of hindsight. In addition, hypothetical trading does not involve financial risk, and no hypothetical trading record can completely account for the impact of financial risk of actual trading. for example, the ability to withstand losses or to adhere to a particular trading program in spite of trading losses are material points which can also adversely affect actual trading results. There are numerous other factors related to the markets in general or to the implementation of any specific trading program which cannot be fully accounted for in the preparation of hypothetical performance results and all which can adversely affect trading results.

Testimonial Disclosure: Testimonials appearing on this website may not be representative of other clients or customers and is not a guarantee of future performance or success.