
It may be soon or never for the major indexes

Key points
- Seasonality suggests that it may be "soon or never" for the major stock market indexes
- The market tends to enjoy something of a "Spring Fling" from the late March to early-June period
- This piece looks more closely at index performance during this impending favorable seasonal period
The major stock market indexes are entering a seasonally favorable period
It is always worthwhile to remember that seasonality - i.e., the tendency for a given asset to trend in a specific direction during a particular time frame on a generally recurring basis - is "climate, not weather." In other words, it does not tell you what is about to happen; it merely tells you what has happened in the past. Seasonality is essentially just another indicator that can alert you to potential opportunities.
With all that in mind, note in the annual seasonal trend charts below that three major U.S. indexes - the S&P 500, the Nasdaq 100, and the Russell 2000 are soon entering a seasonal period that tends to show market strength.
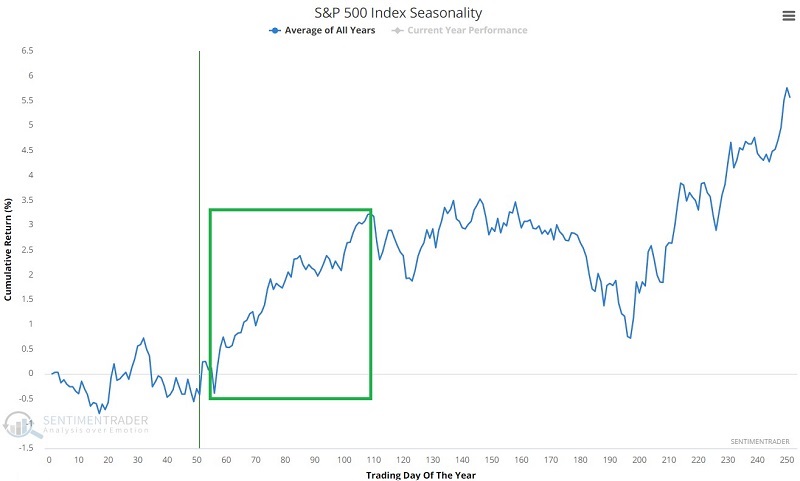
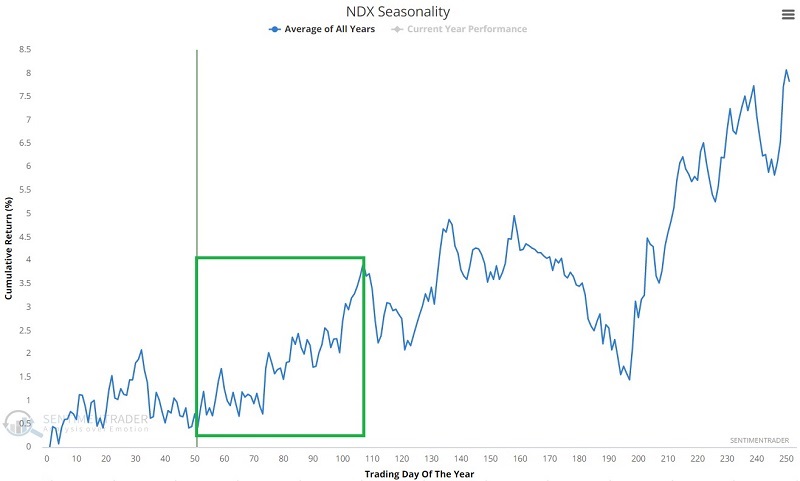
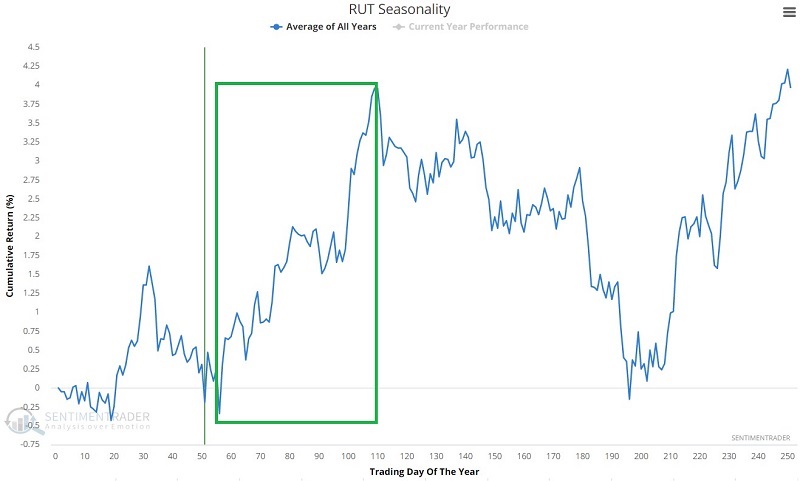
While the Nasdaq 100 has slightly different trough and peak dates, for the test below, for all three indexes, we will focus on the period extending from the close on Trading Day of the Year (TDY) #56 through TDY #109. For 2023, this period extends from the close on 2023-03-23 through 2023-06-08.
Let's take a look at historical index performance during this period.
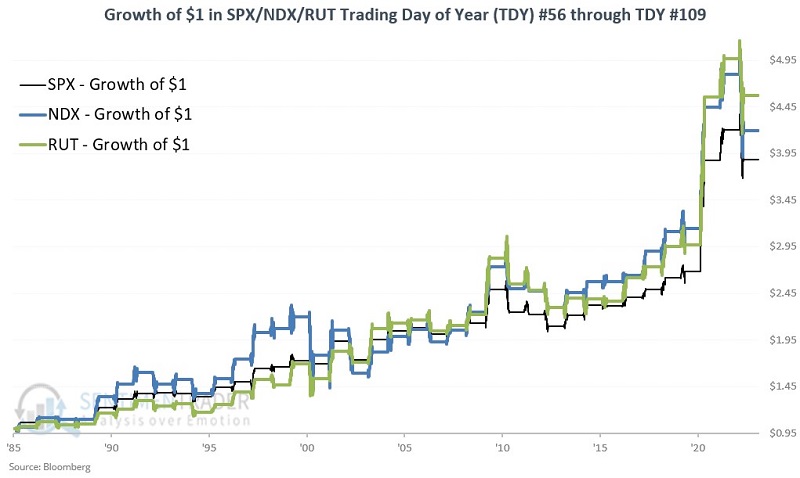
Index performance during the "Spring Fling"
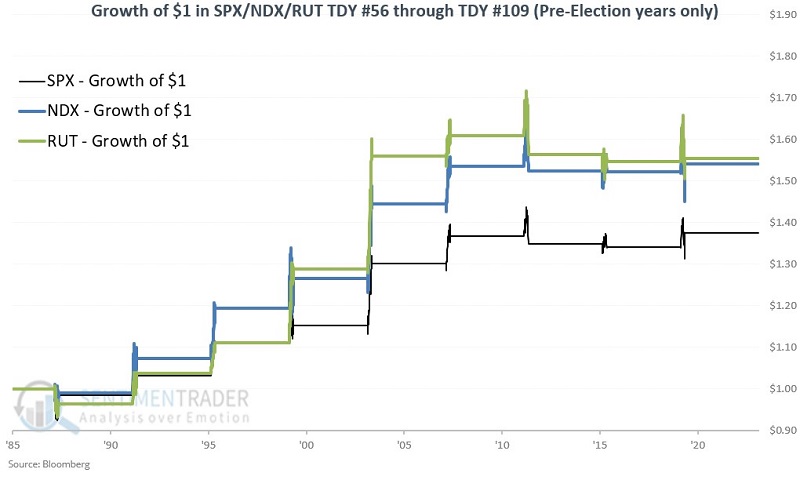
The chart below displays the growth of $1 invested in each of the three indexes only during the TDY #56 through TDY #109 period every year since 1985 (which is the first year we have data for NDX). The overall top performer to date during this period has been the Russell 2000. However, a closer look at the chart shows much variation over the years.
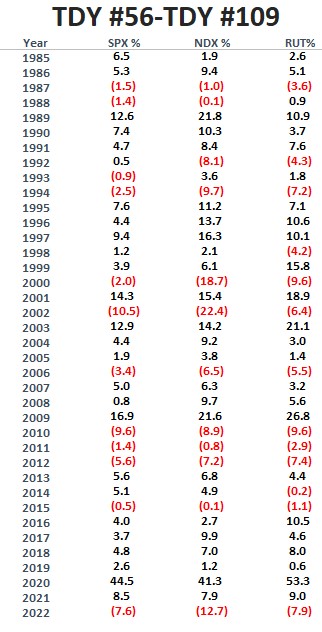
The table below displays year-by-year performance during the period in question.
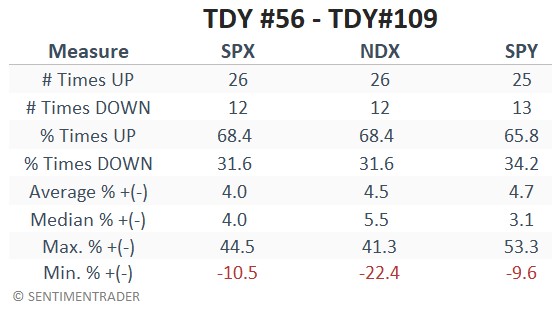
The table below summarizes performance results.
A closer look at pre-election years
2023 is a pre-election year in the four-year cycle. During pre-election years, the Nasdaq 100 performed exceptionally well during the first seven months as a whole (see here). But for this test, we will examine index performance during the TDY #56-TDY #109 period only during pre-election years. The chart below displays the growth of $1 invested in each index.
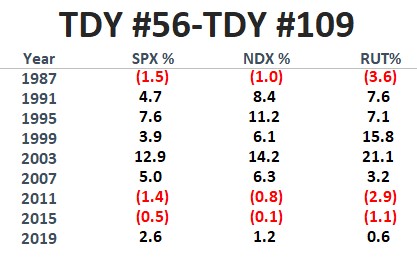
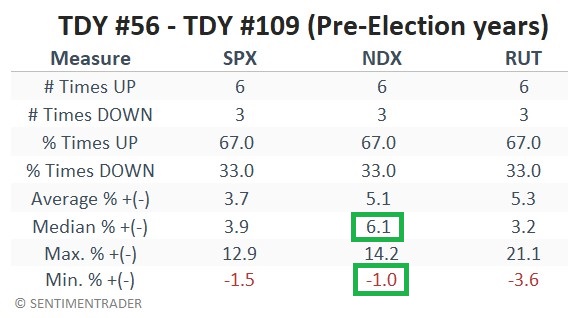
The table below displays year-by-year performance during the period in question only during pre-election years.
The table below summarizes performance results.
What the research tells us…
Once again, it is difficult to deem one particular index as "the best." For the sake of argument, there are a few factors to consider regarding the Nasdaq 100. So far, NDX is by far the top performer for 2023 (NDX +14.4%, SPX +2.0%, RUT -2.0%). There is no guarantee this type of leadership will continue. Still, from a relative strength point-of-view, there is good reason to "go with the strength," especially given NDX's historical performance from January through July of the pre-election years. It should also be noted in the table above that NDX has the highest median pre-election year TDY #56-TDY #109 return (+6.1% versus +3.9% for SPX and +3.2% for RUT). Finally, note that the worst pre-election year TDY #56-TDY #109 return for NDX was just -1.0%.
In sum, if the stock market is going to reverse its February-March funk, it may be "soon or never." And if a bounce is in the cards, the Nasdaq 100 (which can be traded via ticker QQQ, the Invesco QQQ Trust) appears to have the edge over the other two indexes.