
It may be soon or never for real estate

Key points
- The real estate sector has been pounded in recent months
- The bad news is that there may be fundamental weakness driving the decline
- On the other hand, sentiment for this sector recently reached a contrarian extreme, and the sector is entering the most favorable seasonal period of the year
The Real Estate sector has run into trouble
The real estate sector has been hit by something of a "Perfect Storm" in the past year. The chart below displays the 12-month rate-of-change in US Home Prices. After soaring to its highest 12-month rate of change ever, housing prices began to fall hard.
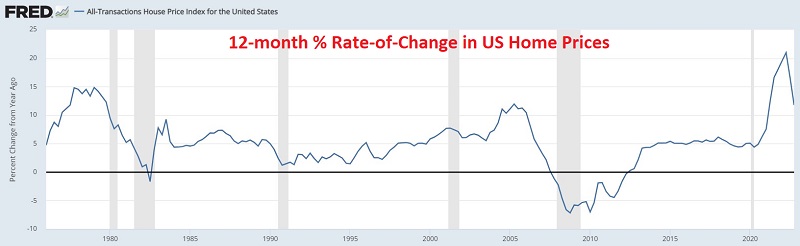
Much of the previous buying surge was due to the record low level of mortgage interest rates. Likewise, much of the drop-off in buying demand resulted from the sharp rise in mortgage rates in the last six months. High home prices and higher mortgage rates are something of a "Perfect Storm" for the housing market.
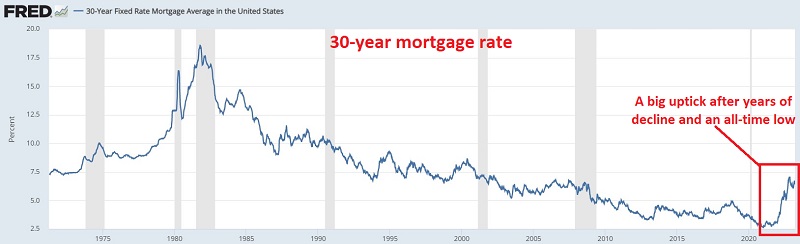
At this point, there is a lot of chatter regarding the potential for "Housing Bubble 2". The fuel for this fire is ripe with still high home prices, now much higher mortgage rates, and - according to many pundits - an impending recession. Given all this, there is plenty of reason to stand aside from the real estate sector.
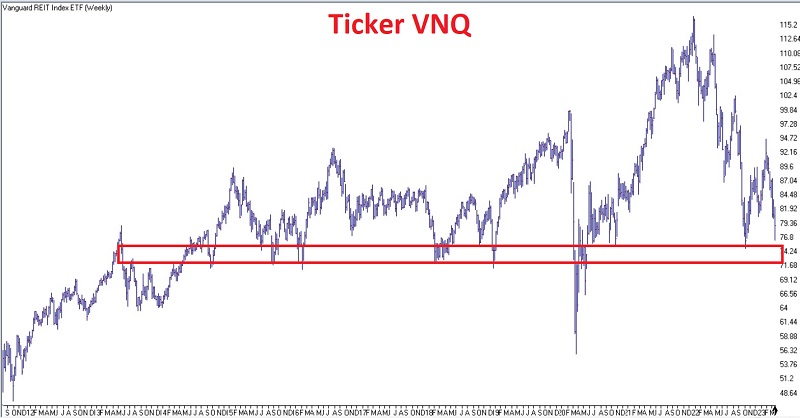
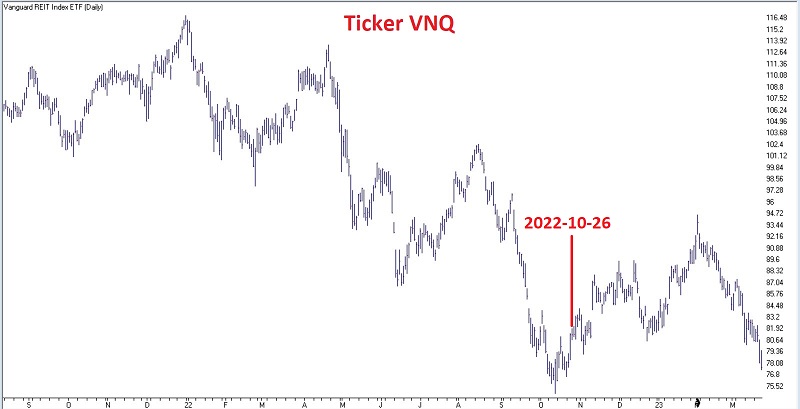
Still, there may be another take for those with a contrarian bent. The chart below (courtesy of AIQ TradingExpert) shows that - despite an avalanche of lousy housing news in recent months - the Vanguard Real Estate ETF (ticker VNQ) still holds above its October 2022 low and is touching a significant area of support. Likewise - as we will discuss next - sentiment and seasonality are now tilting toward the favorable side.
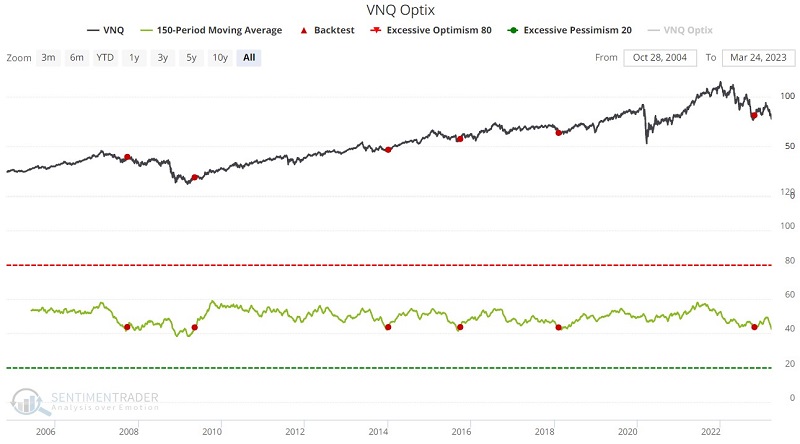
Sentiment reached a bearish extreme in 2022
The chart below displays our Optix indicator for Vanguard Real Estate ETF (VNQ). The red dots highlight when the 150-day average for VNQ Optix crossed above 43.5 for the first time in 12 months (the theory is that selling in the sector reached a bearish extreme and has been "washed out").
The table below summarizes VNQ performance following previous signals.
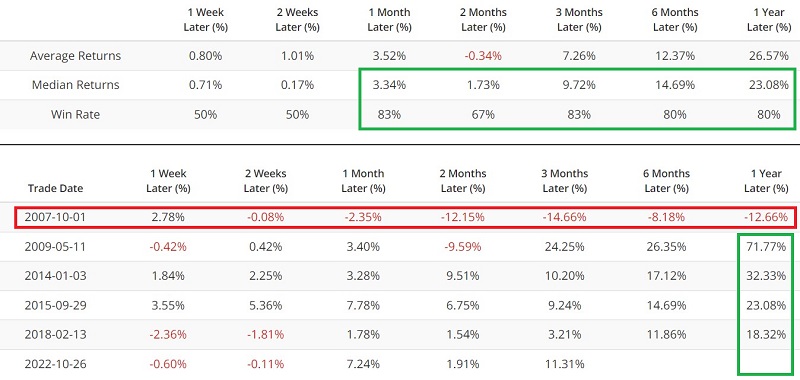
The October 2007 signal was clearly too early as the housing bubble burst the following year, and VNQ fell -12.66%. Given the currently unfavorable fundamentals, the possibility of a repeat cannot be ignored. Still, the following four signals saw the real estate sector rally strongly. Amid much talk of another real estate bubble, the indicator gave a signal on 2022-10-26. As you can see in the chart below, VNQ rallied +15% into early February 2023 before plunging over -17% since.
Real estate is entering a seasonally favorable period
The chart below displays the annual seasonal trend for ticker VNQ and highlights the tendency for strength during the middle of the year.
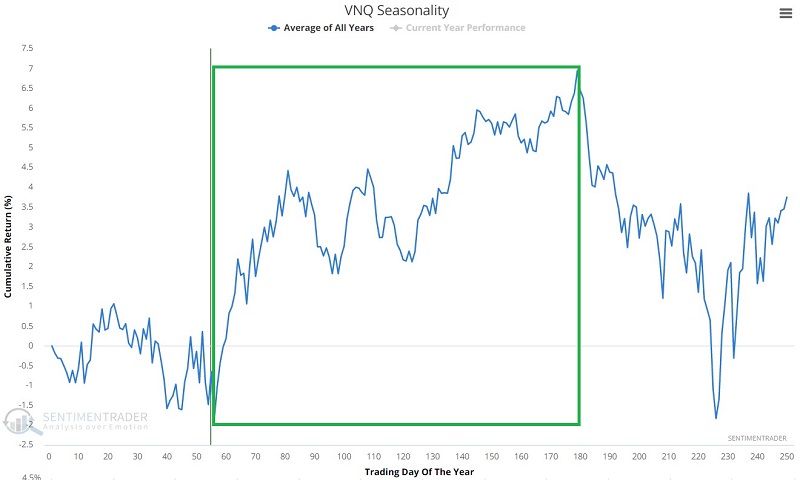
Let's focus on the period highlighted in green in the chart above. The chart below displays the growth of $1 invested in the S&P 500 Real Estate sector index only from the close of TDY #56 through the close of TDY #172 every year since 1953. For 2023, this period extends from the close on 2023-03-23 through 2023-09-11.
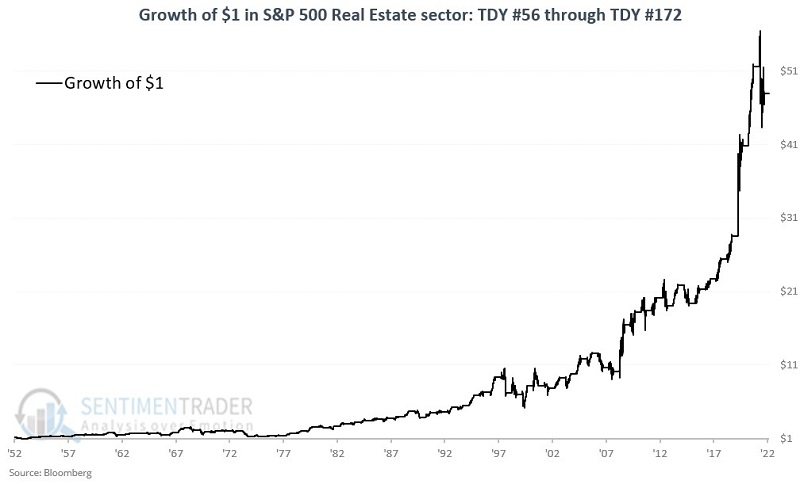
The chart below displays the same results on a logarithmic scale.
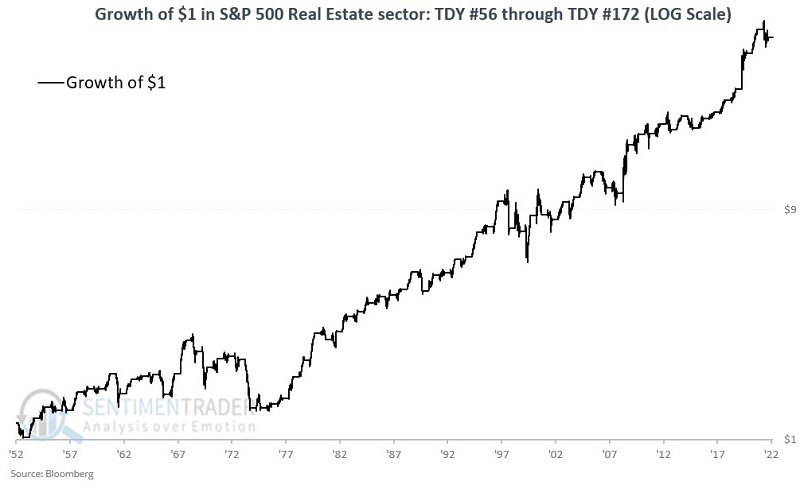
The good news is that the favorable long-term trend is unmistakable. The bad news is that there is no guarantee from year to year, and when this sector is bad during this supposedly favorable period, it can be awful.
The table below summarizes performance.
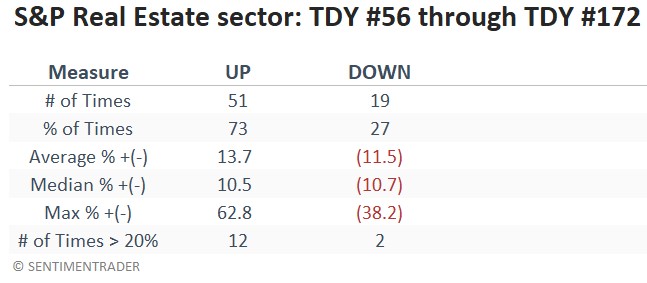
Of the 19 Down years, the S&P 500 Real Estate sector lost more than -10% on ten separate occasions (the worst was a -38.2% blowout in 1974). This suggests that traders willing to take the bullish contrarian play in real estate should pay close attention to the October 2022 low as a potential "Uncle" point.
What the research tells us…
The reality is that one can make a compelling case either way for real estate at the moment. If fundamentals create a wider turndown in the housing market, market sentiment can worsen before things turn around, and seasonality may be a non-factor. That said, the current configuration of sentiment and seasonality is the type that often - though notably, not always - leads to a surprising rebound.