
It may be soon or never for healthcare

Key Points
- The healthcare sector has been dead money for two and a half years
- A bevy of indicators have recently flashed favorable signals for this sector
- If the healthcare sector fails to rally soon, it may be a sign of a deeper problem - so the patience to wait for an actual reversal to occur may be in order
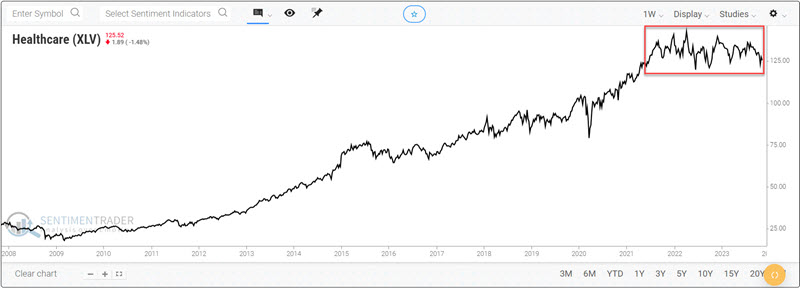
The healthcare sector has been a laggard
The chart below displays price action for the SPDR Health Care Sector ETF (ticker XLV). This ETF has essentially been trading sideways for 30 months since May 2021.
Below, we highlight several indicators recently giving favorable signals or portending higher prices in the not-too-distant future. Despite this, investors may be wise to wait for signs of life before jumping in.
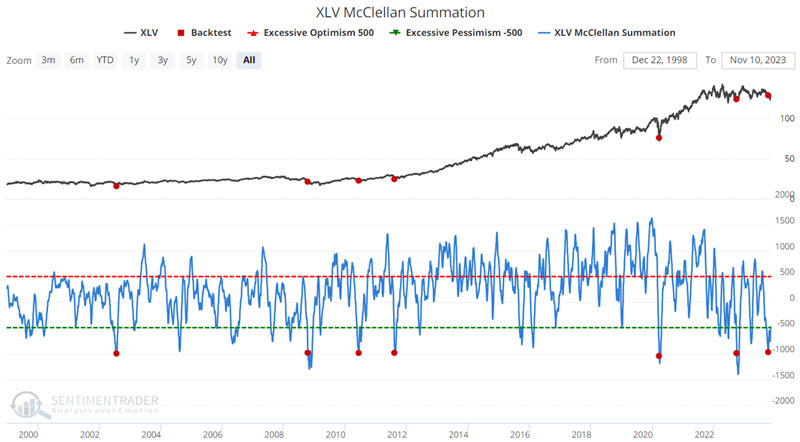
McClellan Summation flashes an oversold signal
The chart below highlights when the XLV McClellan Oscillator crossed below -970 for the first time in three months. The most recent signal occurred on 2023-10-05.
The table below displays a summary of performance.
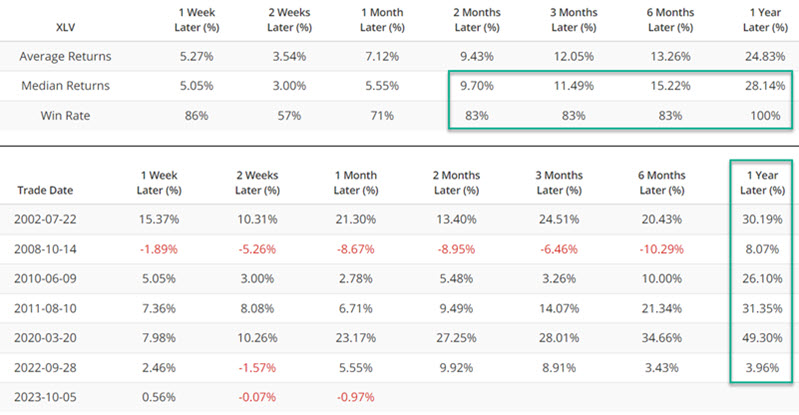
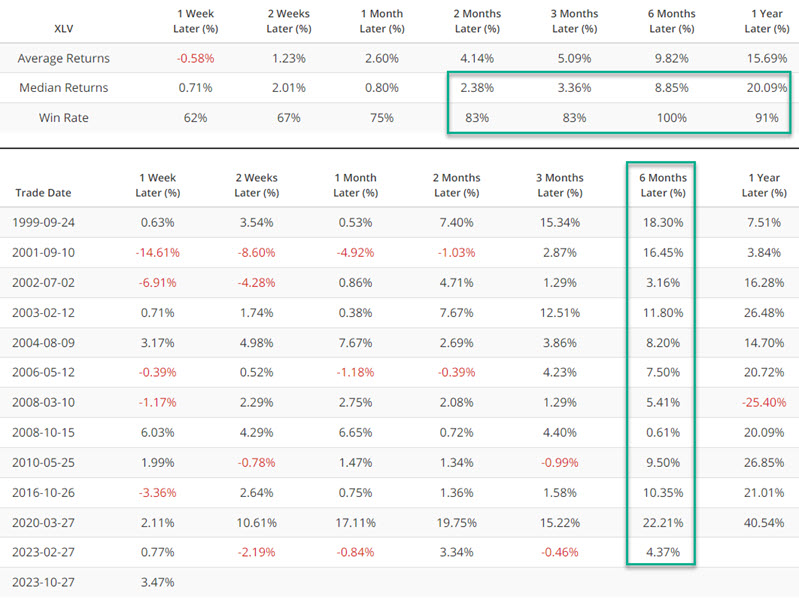
The sample size is relatively small, but results have skewed heavily to the favorable side. That said, ticker XLV has worked lower since the latest signal in early October. This could signify a more profound weakness or prove a better buying opportunity.
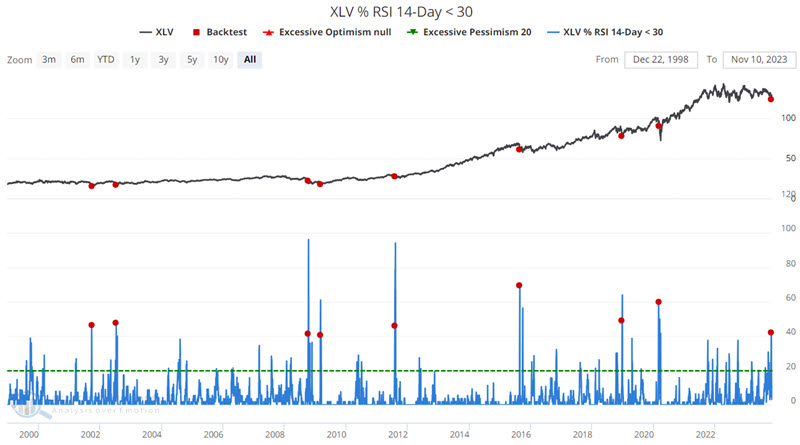
The percentage of XLV stocks with low RSI readings spiked to a significant level
The chart below highlights when the XLV % RSI 14-Day < 30 crossed above 40% for the first time in three months. This action reflects massive selling and possibly wholesale dumping of healthcare sector stocks. This kind of panic often precedes higher prices. The most recent signal occurred on 2023-10-27.
The table below displays a summary of performance.
Percent of XLV stocks above 50-day average plunges
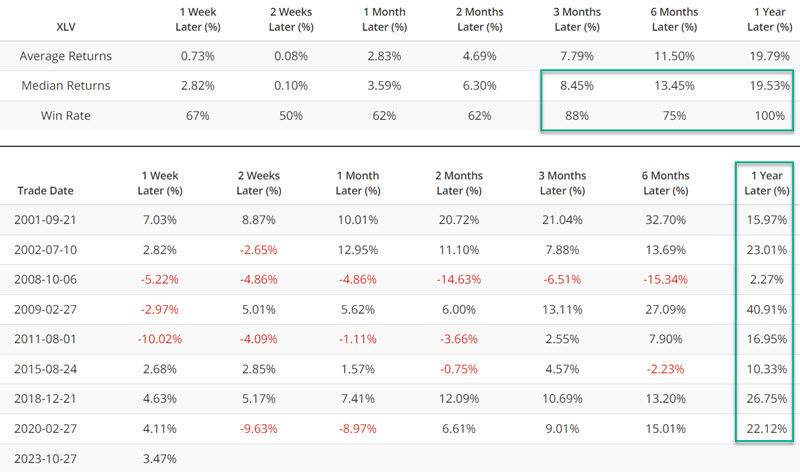
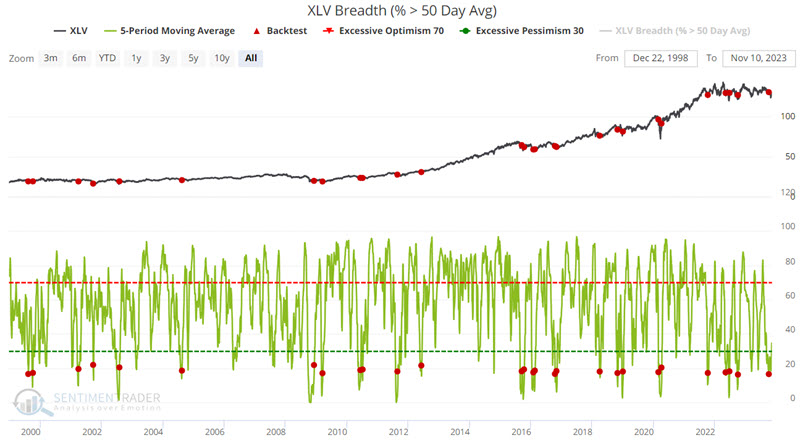
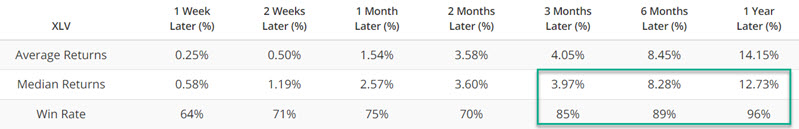
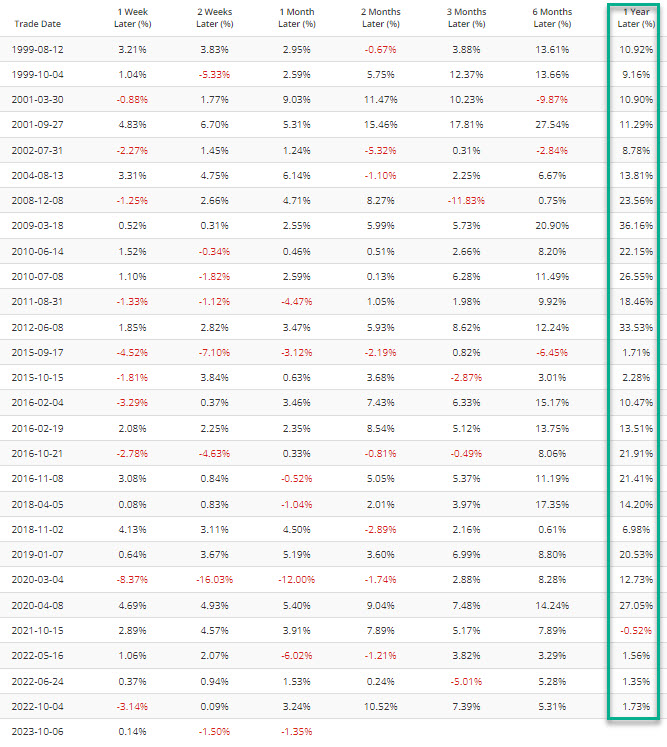
The chart below highlights when the XLV Breadth (% > 50 Day Avg) crossed above 16%. Like the previous signal, this type of action often signals capitulation on the part of investors as they dump healthcare stocks en masse. The most recent signal occurred on 2023-10-06.
The tables below display a summary of performance.
Investors throwing in the towel on the healthcare sector
The recent action of the XLV Optix indicator is another sign of capitulation on the part of investors. The chart below highlights when the 50-day average for XLV Optix crossed below 36.5% for the first time in three months. The most recent signal occurred on 2023-10-27.
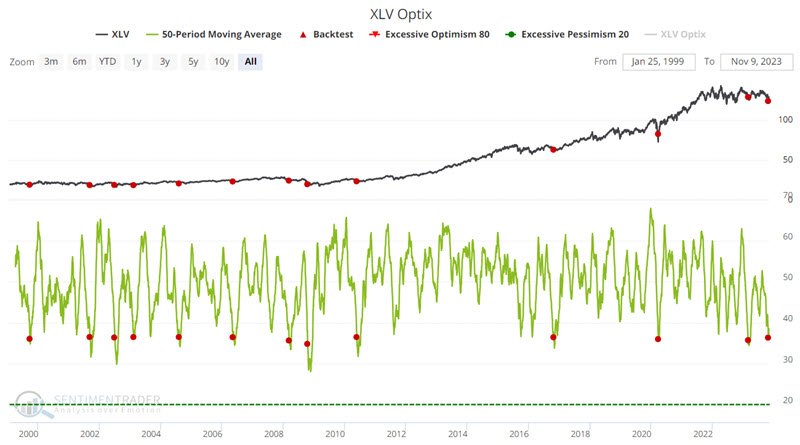
The table below displays a summary of performance.
Seasonality may offer a potential tailwind
The chart below displays the annual seasonal trend for ticker XLV along with the actual year-to-date performance for XLV.
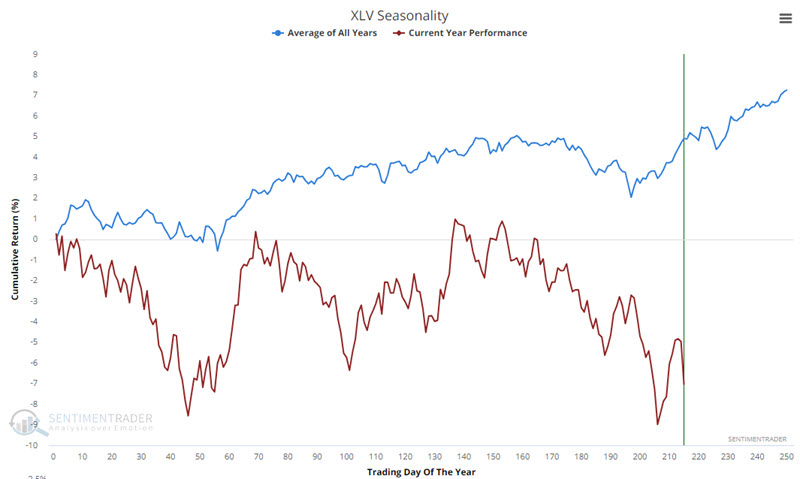
We can see that XLV has struggled to bounce off its low following the expected seasonal turn on Trading Day of Year #197. Another potentially favorable period extends from the close on TDY #226 through TDY #11 of next year. For 2023-24, this period will extend from the close on 2023-11-24 through 2024-01-17.
To backtest this period, we use the S&P 500 Healthcare sector index (the index that XLV tracks) starting in 1953. The growth of $1 invested in this sector only during this period appears in the chart below.
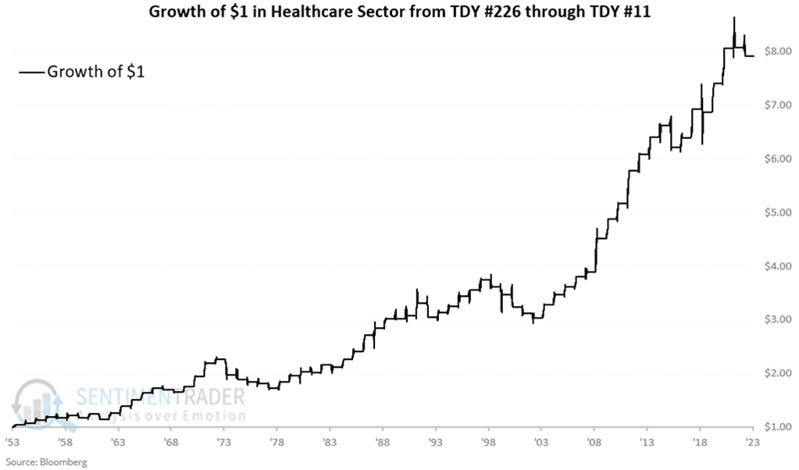
The table below summarizes performance during this purportedly favorable seasonal period.
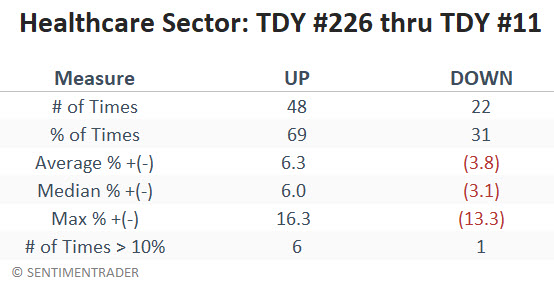
A 69% Win Rate reminds us that an advance in the sector during this period is far from a sure thing. Nevertheless, results have historically skewed to the favorable side - with up years significantly outperforming down years. If the healthcare sector is going to get off the deck, this is a time when investors should be paying close attention.
What the research tells us…
The healthcare sector has been a definite laggard in recent years and has gained no new ground since mid-2021. Buying laggards is typically not the best idea until they show some signs of life. That said, much evidence is beginning to pile up on the favorable side of the ledger for this far-out-of-favor sector. Whether an investor should start allocating now to healthcare or wait for the signs above of life is a personal choice. The bottom line, however, is that now appears to be an excellent time to put healthcare "on the radar" and to be prepared to take advantage of this beaten-down sector if it begins to reverse.