
It may be soon or never for gold rally - the ETF edition

Key points:
- There is a potentially favorable seasonal setup forming in gold
- We can use the GLD fund to trade the same setup
- The fund has shown a gain in 15 out of the past 18 years during these windows
A word on the data used for testing
Earlier this week, I highlighted a potentially favorable setup forming in gold.
The original article used a continuous futures contract as a proxy for gold bullion. This piece will focus on SPDR Gold Shares ETF (GLD), an ETF intended to track the price of gold bullion. The futures data file for gold used in the original article contains electronic trading on holidays, so it will typically include more trading days within a given year than GLD, which trades only when the NYSE is open. Likewise, the futures contract has over forty years of history, while GLD started trading in 2004. As a result, there are differences in the Trading Day of Year used for ETF versus gold futures.
A quick review of the original gold setup
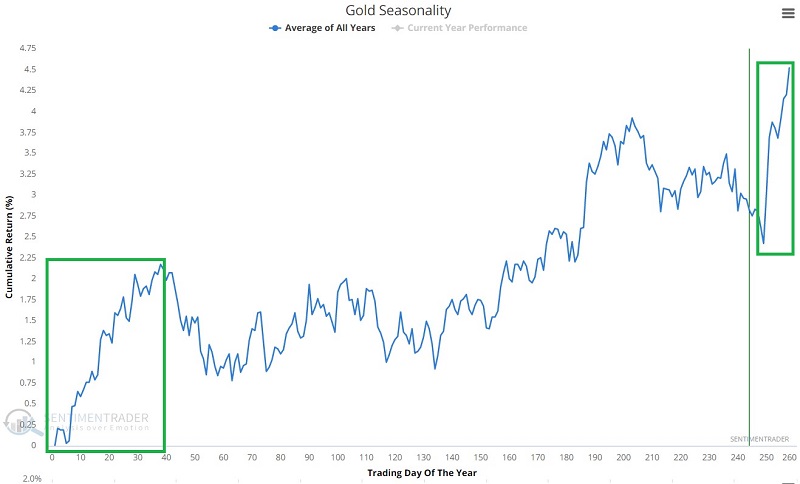
For full details, please see this article. In a nutshell, gold is about to enter one of the most favorable periods of the year (Trading Day of Year #249 through TDY #39 of 2023). The chart below displays the annual seasonal trend for gold. Note that we are about to enter what is typically one of the most favorable times of the year for gold.
 The chart below displays the annual seasonal trend for the SPDR Gold Shares ETF (GLD), an ETF intended to track the price of gold bullion. Note that for GLD, the favorable year-end/new-year period is slightly different and extends from the close of TDY #246 through the close of TDY #36 of the following year.
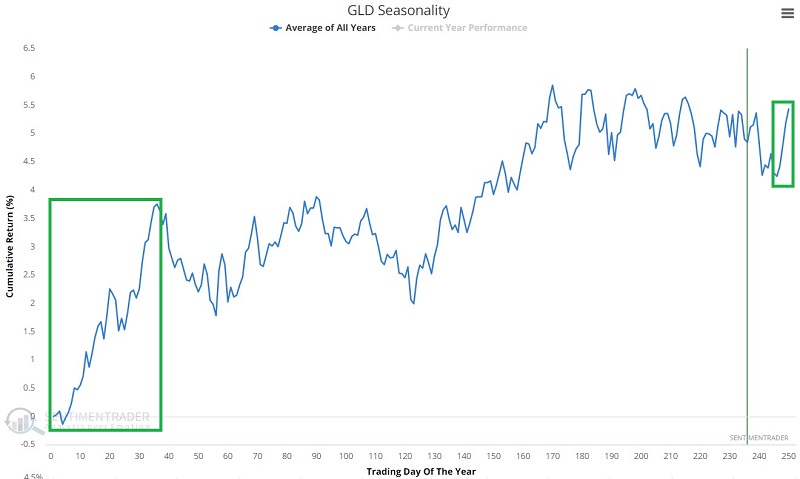
This will result in different trading dates between gold bullion and ticker GLD during most years. For GLD, the seasonally favorable period this year extends from the close on December 22 through the close on February 23 next year.
Testing seasonality alone
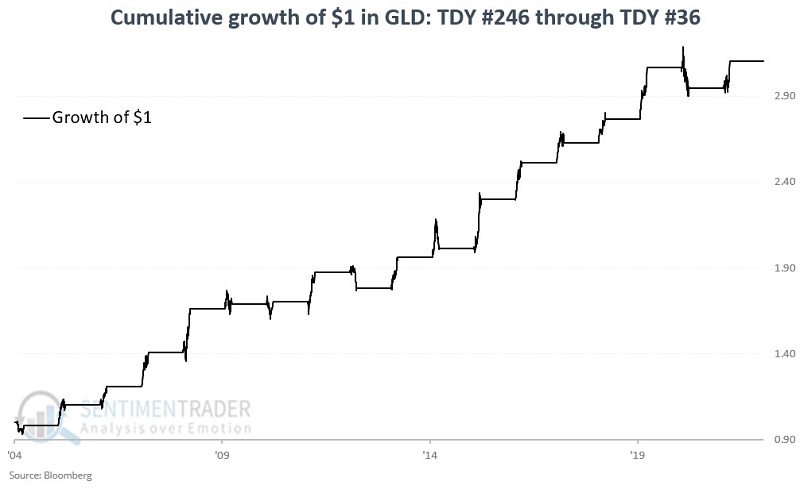
First, look at the performance of GLD during the TDY #246 through TDY #36 period each year since GLD started trading in 2004. The chart below displays the cumulative growth of $1 invested in GLD only during this seasonally favorable period.
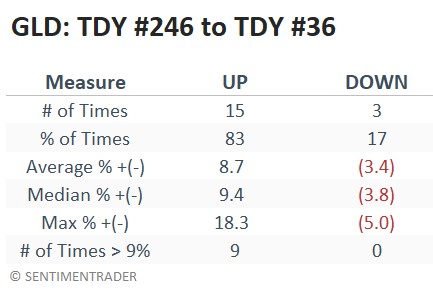
The table below shows year-by-year results for GLD
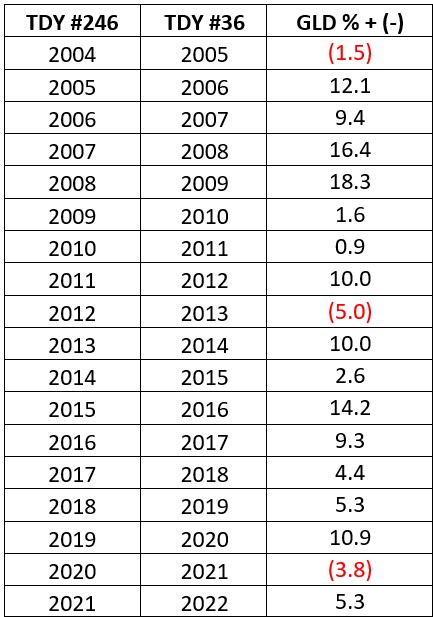
The table below summarizes GLD performance during this seasonally favorable period. It resulted in 15 gains out of 18 years, with much better average gains than average losses.
Adding a trend filter
In the original article, we found that adding a simple price filter often helped keep us out of gold several times when the seasonally favorable year-end/new year period showed weakness instead of strength. The great bulk of those occasions occurred between 1981 and 2001, which was before GLD started trading. Nevertheless, let's apply the same filter to ticker GLD.
Specifically:
- We will call the price trend favorable if GLD is trading higher than it was 252 trading days prior
- We will call the price unfavorable if GLD is trading lower than it was 252 trading days prior
The chart below displays a daily chart for GLD with the 252-day % rate-of-change at the bottom.
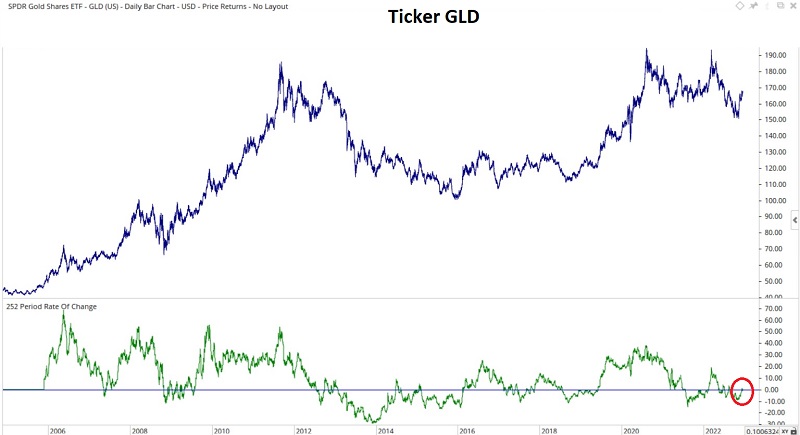
The chart above shows that the 252-day rate-of-change for GLD is just barely positive at the moment.
The blue line in the chart below displays the cumulative growth of $1 invested gold only when a) GLD is higher than 252 days prior, and b) the current TDY is greater than 246 or less than or equal to 36 versus the initial results shown above.
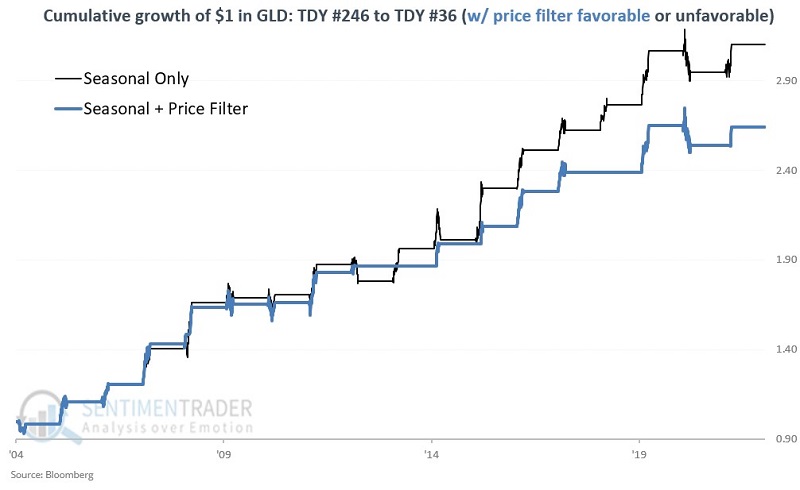
As you can see, adding the price filter reduced the overall profit for GLD since 2004. However, there are a few things to consider.
As we saw in the original article that focused solely on gold itself, there will likely be times in the future when the price filter will help keep a trader out of GLD when a bear market overwhelms the typical late-year/new-year seasonal strength.
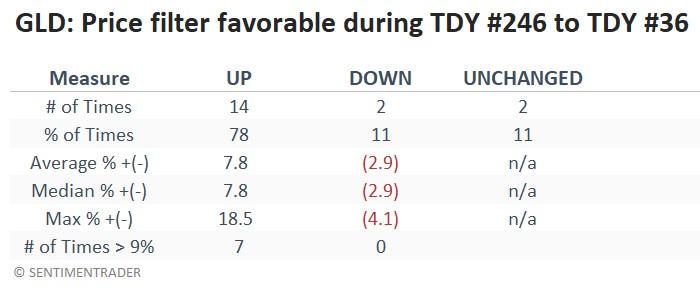
Also, the table below displays a summary of holding GLD only when the price filter and seasonal trend are positive. There has been minimal downside action when this configuration was in force since 2004.
As of December 9, GLD is slightly above its price 252 trading days ago. So, as of this moment, our price filter is favorable. However, this should be revisited as the following seasonally favorable period approaches, starting at the close on December 22.
What the research tells us…
Gold has tended to rally during the late-year and early new-year periods. GLD offers non-futures traders the ability to trade gold as they would shares of stock. Ensuring that GLD is in an uptrend, such as above its price 252 days prior, appears to improve the odds from a risk/reward point of view.