
It may be soon or never for gold rally

Key points:
- Gold has been creeping higher after declining for seven consecutive months
- One of the most favorable seasonal periods of the year is about to begin
- A simple price filter may improve results
Gold is at a critical juncture
Gold had several huge runs - in the late 1970s, from 2001 to 2012, and from 2018 to 2020. It has also trudged sideways to lower for five to twenty years. Regarding recent price action - and as with most charts - different traders will see other things.
The monthly chart below displays the price action of gold futures since the mid-1970s.
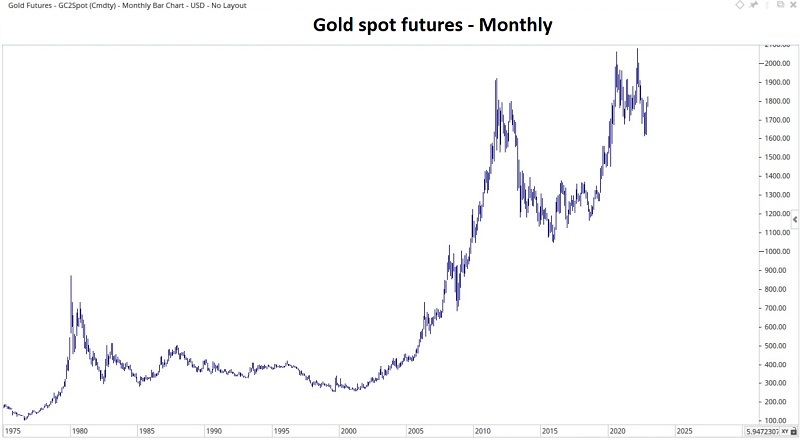
Some traders see a massive, multi-year cup-with-handle formation building since 2012 (with the last critical part - the handle - forming now at the far right) and expect an explosive move higher, especially once the old high is taken out. Other traders see a massive double top and a market about to break lower.
A Gold seasonal rally period approaches
Last week, I wrote about a seasonal anomaly for gold mining stocks. Now, let's turn to the yellow metal itself. The chart below shows the annual seasonal trend for gold. We are about to enter what is typically one of the most favorable times of the year for gold.
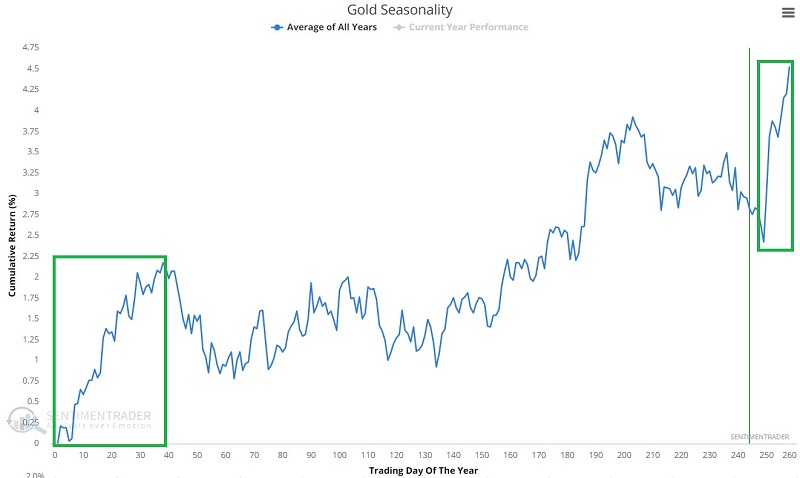
The period in question begins on the close of Trading Day of the Year #249. It extends through the close of TDY #39 of the following year. For 2022-23 this period extends from the close on December 15 through the close on February 23 next year.
To best illustrate returns, we will use the continuous futures contract as a proxy for gold bullion. The chart below displays the cumulative growth of $1 invested in gold bullion held long during these seasonal windows starting in December 1975.
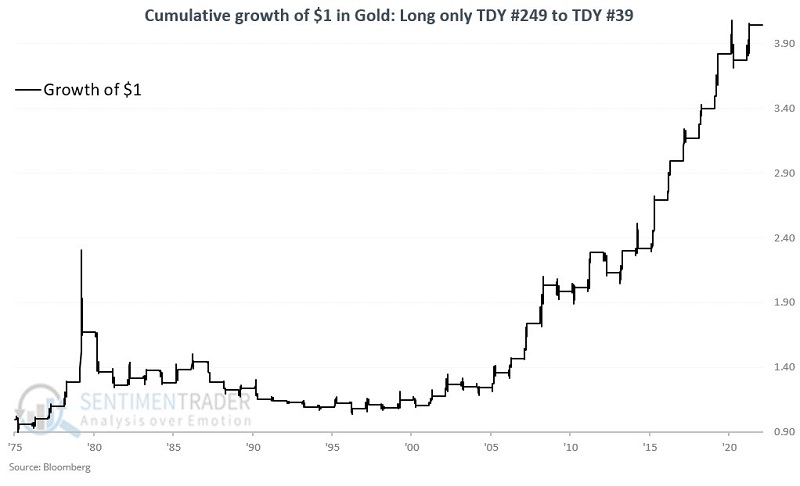
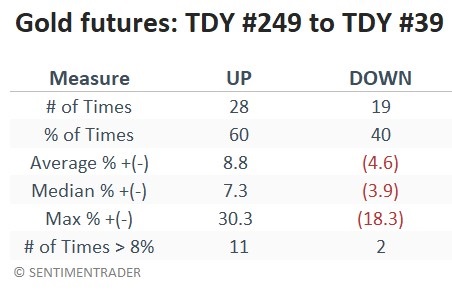
Gold rallied 60% of the time during these windows, which is decent. Its average return during the winning years was nearly twice as large as the average loss during the losing years. While it did suffer a couple of large losses, it was much more common to see large gains.
Adding a price trend filter improves the reliability
The equity curve above resembles the overall price action for gold over the past 47 years. We see strong uptrends in the late 1970s and since the early 2000s, with lackluster results between the early 1980s and the early 2000s.
To improve results, let's add a price trend filter and compare results during the seasonally favorable year-end/new year period, depending on whether the overall price action is favorable or unfavorable.
Gold is a market that typically trends well. Strength tends to beget more strength, and weakness tends to beget more weakness. So we will keep it simple and consider whether gold has advanced or declined over the previous year as a trend measure. Specifically:
- We will call the price trend favorable if gold is trading higher than it was 252 trading days prior
- We will call the price unfavorable if gold is trading lower than it was 252 trading days prior
The blue line in the chart below displays the cumulative growth of $1 invested gold only when a) gold is higher than it was 252 days prior, and b) the current TDY is greater than 249 or less than 39 (blue line), versus the original results shown above (black line).
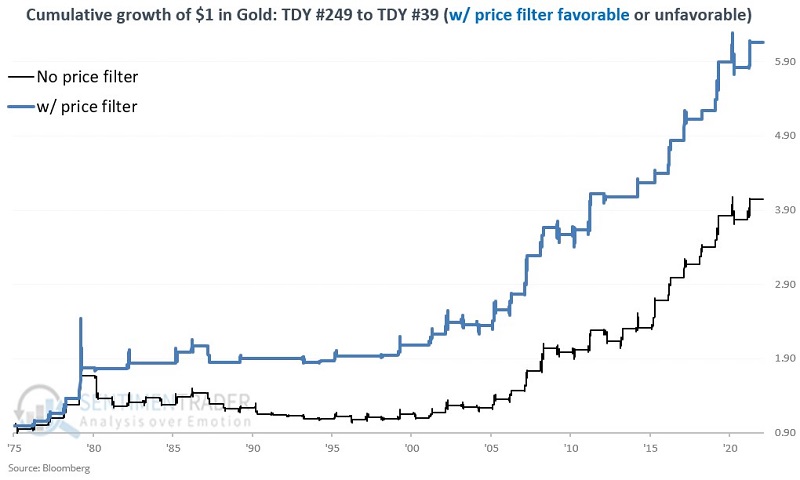
As you can see, trading a long position in gold during the seasonally favorable period only if the price is in an uptrend appears to improve overall long-term results.
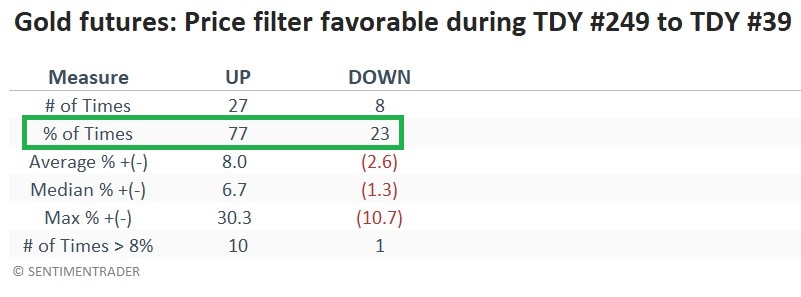
Adding the price filter improved the winning percentage to 77%, and the average gain during winning years vastly outpaced the losses during losing ones. And there was a much greater chance of a big win than a big loss.
The better understand what adding the price filter accomplishes, the chart below shows the cumulative growth of $1 during the seasonal windows but when the trend was unfavorable.
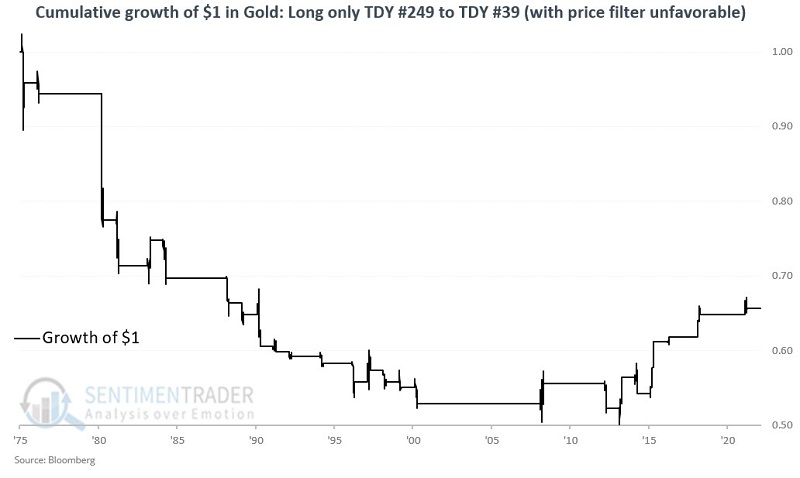
A trader who sat out during the seasonally favorable period if the price trend filter was unfavorable would have missed a few seasonal rallies since 2008 but would also have sat out some or all of the declines in 15 of 17 years when the price filter was invoked as unfavorable between 1975 and 2000. Adding the price filter results in sitting out the favorable seasonal period entirely during twelve years,mostly between 1980 and 2001.
As of December 9, the futures price that we use was trading at $1,797.32. This is below its price 252 trading days ago. So, as of this moment, our gold price filter is unfavorable. The price of gold must rise in the days and weeks ahead to flip the price trend filter to favorable.
What the research tells us…
Gold has tended to rally during the late-year and early new-year periods. However, the strength and consistency of this rally appear to be highly dependent upon whether gold is in a sustained price uptrend or not. As the beginning of the favorable seasonal period nears, price action must improve to flip the price trend filter to favorable. If gold begins to rally in earnest in the weeks ahead, there may be a good reason to jump aboard. But if gold fails to rally, it may signify that more trouble is ahead.