
It may be soon or never for bonds

Key Points
- Treasury bonds recently (finally) bounced off of their lows
- Some pundits are arguing that a slowing economy will push treasury yields lower
- Long-term treasury bonds are entering arguably the most favorable seasonal period of the year
- TLT Open Interest has flashed a rare bullish signal
Treasury bonds and yields
Long-term treasury bonds are a pure play on the trend of interest rates. Interest rates have trended higher in recent years; thus, bonds have been hit hard. The charts below (courtesy of StockCharts) display tickers $TYX (an index of 30-yr. treasury yields) and ticker TLT (iShares 20+ Year Treasury Bond ETF).
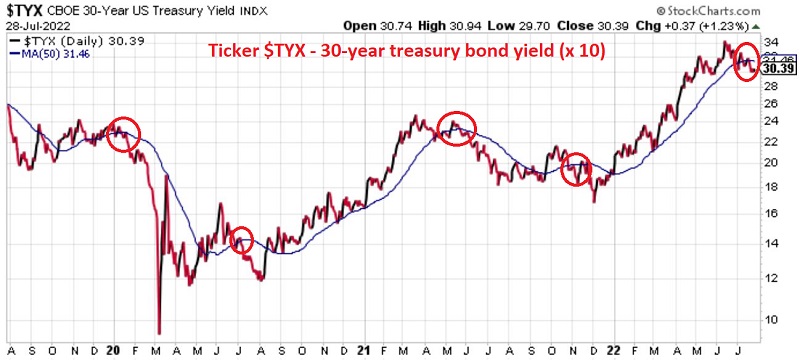
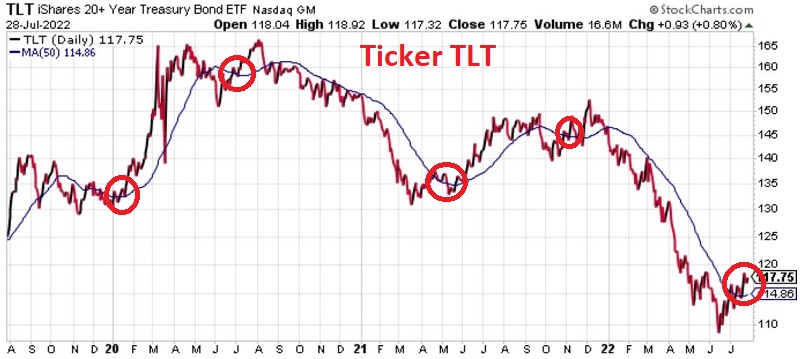
Note the inverse relationship in the charts above - when $TYX rises, TLT falls and vice versa. Note also that rates have sagged recently, and TLT has finally moved back above its 50-day moving average. Is this the start of a new favorable trend for t-bonds? We can't say for sure. But there is some evidence to suggest that if t-bonds are going to rally this year, it may happen sooner than later.
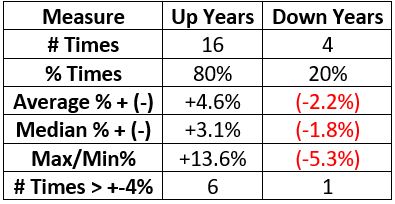
TLT Seasonality
The chart below displays the annual seasonal trend for ticker TLT (iShares 20+ Year Treasury Bond ETF).
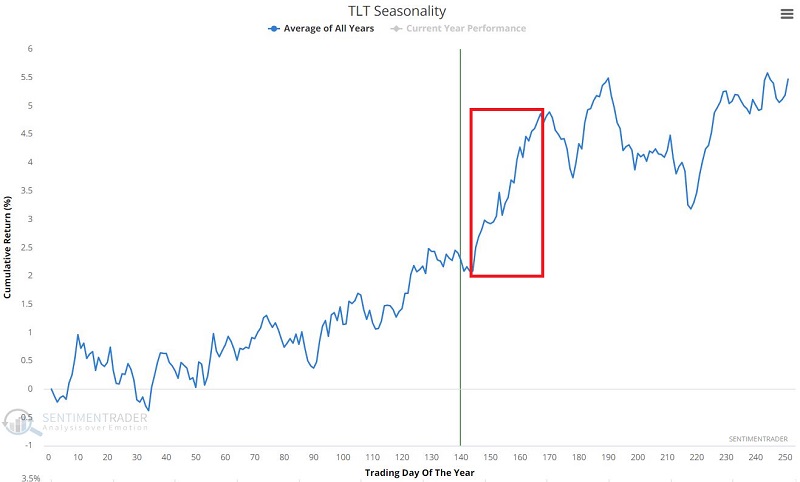
Note the favorable seasonal period that extends from the close on Trading Day of Year #144 through TDY #167. For 2022 this period extends from the close on 7/29 through the close on 8/31.
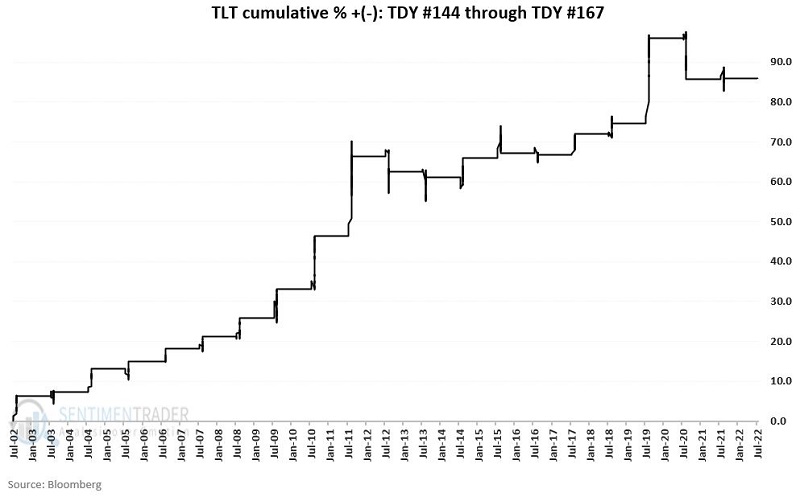
The chart below displays the cumulative % gain/loss from holding long TLT ONLY during this period every year since 2002.
The table below summarizes TLT performance during this seasonally favorable period.
TLT Open Interest Ratio
This data series tracks the number of outstanding TLT put options divided by the number of outstanding TLT call options. The chart below displays those days when this data series was below 0.5.
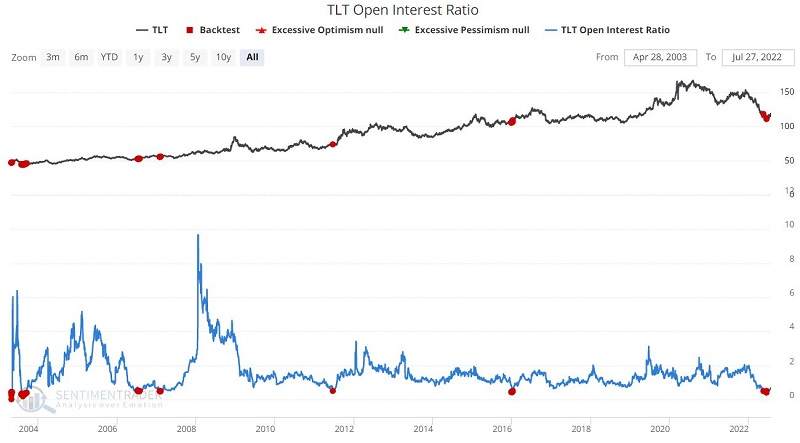
The table below displays a summary of TLT performance following previous readings below 0.5.
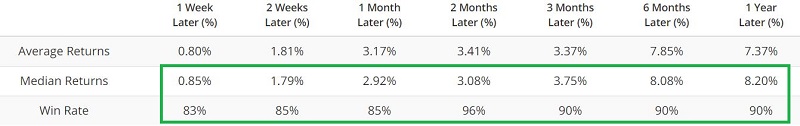
Virtually all time frames show above-average Win Rates, including the 1-month period - which shows a Win Rate of 85%.
Playing TLT with options
The most straightforward approach to playing the bullish side of TLT would be to buy 100 shares of TLT. However, at $117.75 a share, this would require committing $11,775. An alternative - and less costly approach would be to buy an in-the-money call option on ticker TLT. In this case, we are not interested in the quirks of the options market (volatility, skew, spread trades, etc.); we simply want to get point-for-point movement with TLT shares (or as close to it as possible) at a fraction of the cost.
Our example trade involves buying the TLT Sep16 2022 110 call @ $8.45. The particulars of this trade and the risk curves appear in the figures below (courtesy of Optionsanalysis).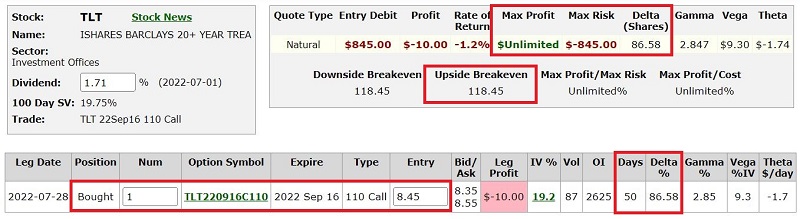
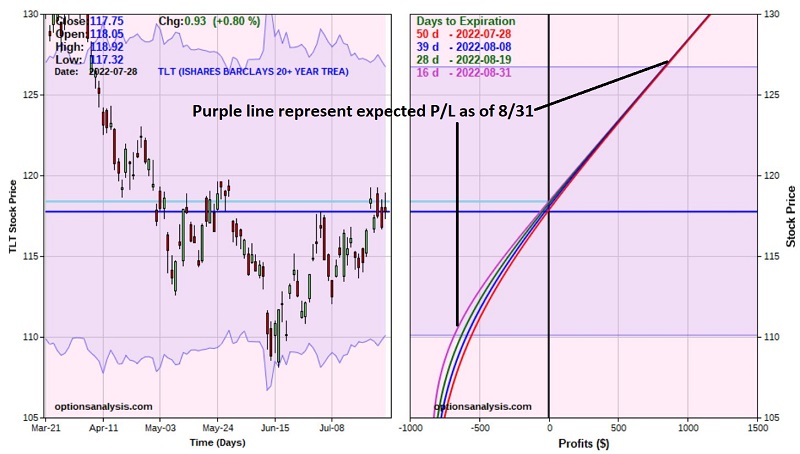
Things to note:
- The cost to enter a 1-lot is $845 (versus $11,775 to buy 100 shares of TLT)
- The option presently has a delta of 86.58. That means that this position is essentially equivalent to holding 86 shares of TLT
- The maximum risk is $845 (which would only be realized if the option is held until expiration on September 16th and TLT was trading below the option strike price of $110 a share)
- We are planning on exiting this trade no later than 8/31 (when the seasonally favorable period peaks)
- The breakeven price is $118.38 - above that price, the option moves point-for-point with TLT shares
Managing the trade:
Because this is essentially a pure bet on seasonality, we will plan to hold the trade until August 31st (or until an acceptable profit level is accrued - which is up to each trader to decide).
We should size the trade so that an $845 loss is an acceptable risk.
What the research tells us…
There is no guarantee that bonds will rally during August. A trade based on a seasonal trend (even with a confirming sentiment indicator) should be considered purely speculative and allocated only a modest amount of risk capital. That said, given the historical performance of TLT during this seasonally favorable period, along with the recent signal from TLT option open interest and the recent signs of a slowing economy, there is a reasonable expectation that if t-bonds are going to rally in 2022, it may be "soon or never."