
It may be now or never for high yield bonds

Key Points
- High yield bonds have been hit hard in recent months
- Several indicators are suggesting a potential washout in this sector
- This market is about to enter a seasonal period of typically favorable performance
- Ticker HYG allows traders to play the high yield sector
High Yield Bonds
High yield bonds are debt securities issued by companies with lower-quality credit. To attract buyers, these companies pay a higher interest rate on these bonds. As long as the company does not default on the principal or interest payments, these bonds' above-average returns are typically attractive to income-oriented investors.
Because the financial fortunes of the underlying company are so important, the performance of high-yield debt is typically more highly correlated to the stock market than to straight bonds. The overall state of the economy generally has more influence over the action of the high-yield bond sector than fluctuations in interest rates - although large swings in interest rates can still have significant influence.
With the decline in the stock market during the first quarter of 2022, combined with weakness in the overall bond market, the high yield bond sector took it on the chin. Will this turn around anytime soon?
Let's look at several heretofore reliable indicators that suggest that it may be now or never for a rebound in high-yield bonds.
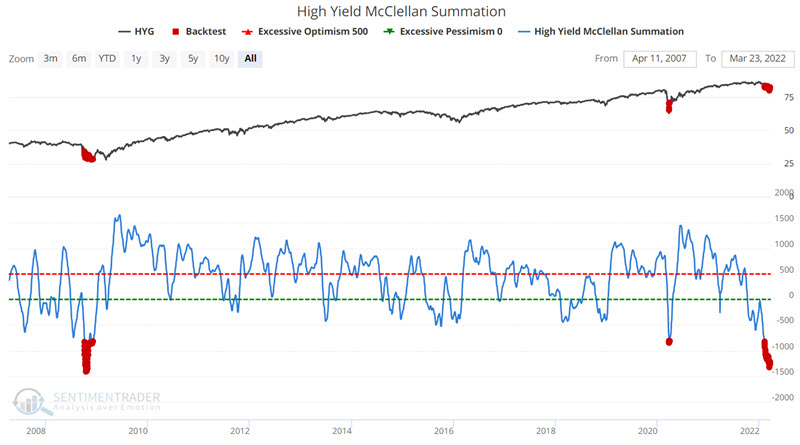
The NASDAQ McClellan Summation Index
High-yield bond performance is generally highly correlated to stock market performance. The chart below highlights with a red dot those days when the High Yield McClellan Summation Index was below -800. Note that this is an infrequent occurrence, and as such, we are dealing with an admittedly small sample size.
The table below displays the performance of ticker HYG (iShares iBoxx $ High Yield Corporate Bond ETF) following all days when the indicator was below -800 (including overlapping days). 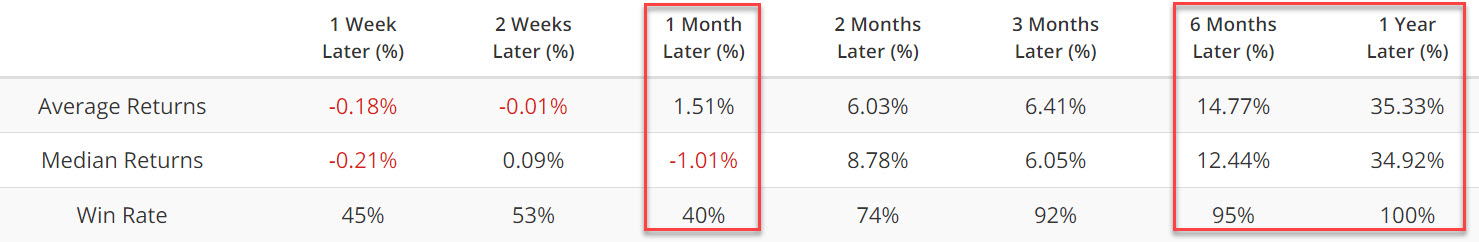
The key things to note are:
- Weakness tended to persist and often get worst in the month following a signal
- However, six and twelve months later typically witnessed a significantly high Win Rate
- Historical 12-month returns have been off the charts (in the 35% range)
However, it is important to note the small sample size we are analyzing once again before getting too carried away. Still, at this time, it is not unfair to consider the current selloff as a potential buying opportunity.
High Yield Bonds NH - NL
This indicator notes the number of high-yield bonds making new 52-week highs and 52-week lows on each given day. We then take a 10-day moving average. Rather than using this measure to find "buy on weakness" opportunities, we look for a reversal from below to above -350 for the 10-day average. We are looking for a "buy on confirmation of a reversal" opportunity.
The chart below displays those occasions when the 10-day average of High Yield Bonds NH - NL crossed above -350.
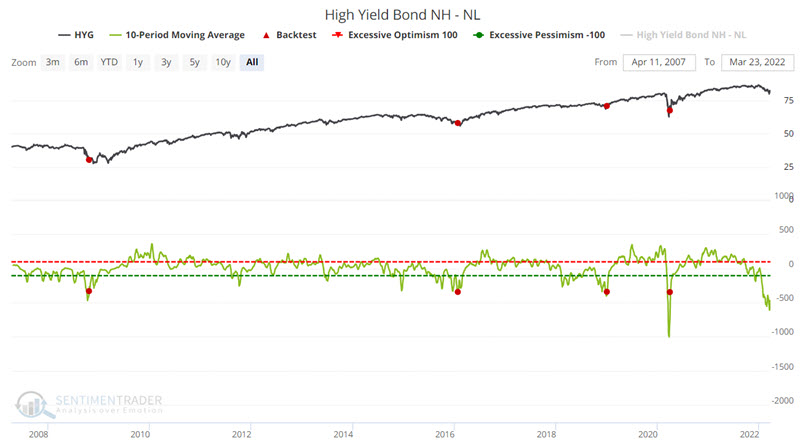
Please note that this signal has not been triggered yet. So, it cannot officially be counted on the "bullish" side of the ledger. Nevertheless, the expectation is that it will move above -350 relatively soon, thus offering a bullish confirmation signal for high-yield bonds.
The table below displays the performance summary for HYG following previous crossings above -350.
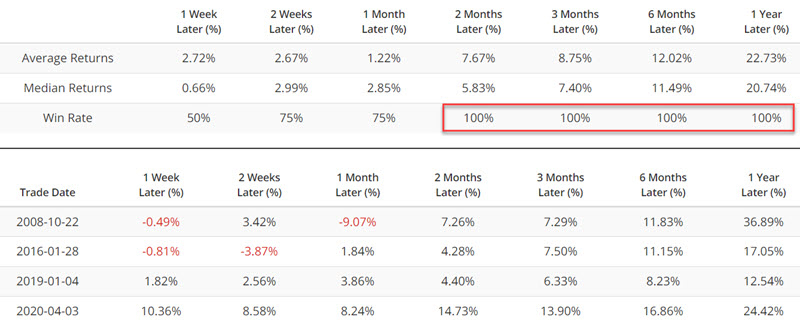
Note the exceptionally high Win Rates following previous signals and the robust Median Returns. Investors are encouraged to follow this indicator closely in the days and weeks ahead for a bullish signal for high-yield bonds.
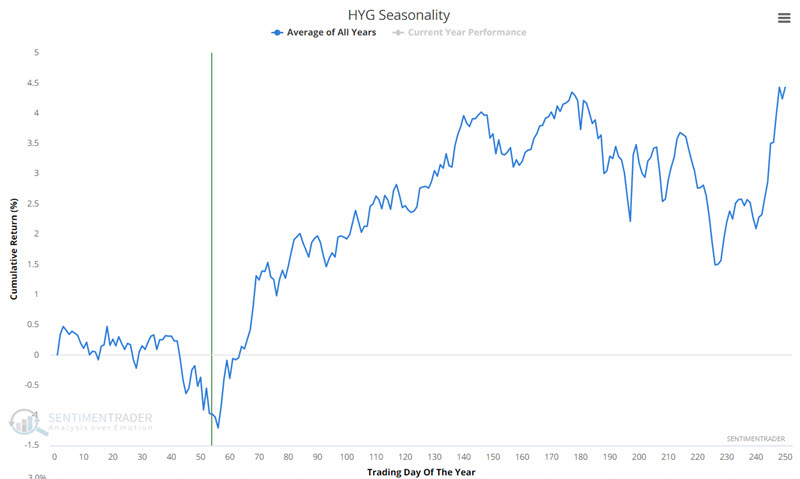
HYG Seasonality
The chart below displays the annual seasonal trend for ticker HYG (iShares iBoxx $ High Yield Corporate Bond ETF). As you can see, we are on the cusp of a favorable seasonal period.
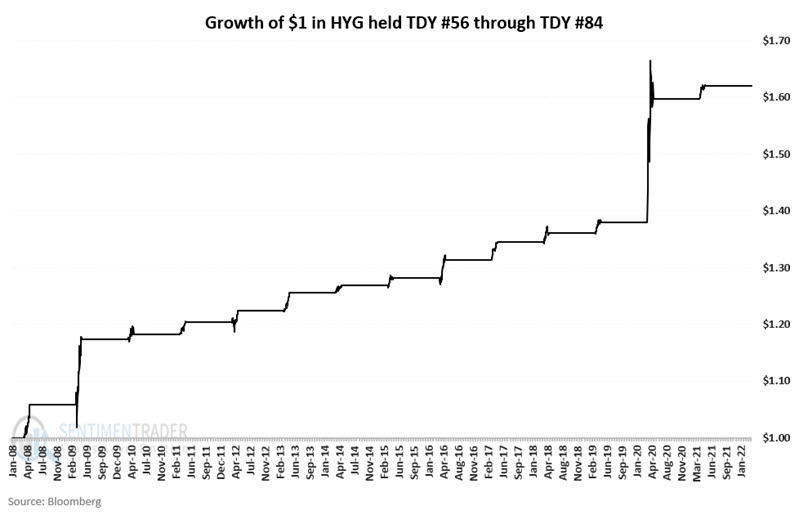
Ticker HYG started trading in 2007. The chart below displays the cumulative growth of $1 invested in HYG every year starting in 2008 between Trading Day of the Year (TDY) #56 and TDY #84. For 2022 the dates are between the close on 3/23 and the close on 5/3.
The table below displays a summary of performance.
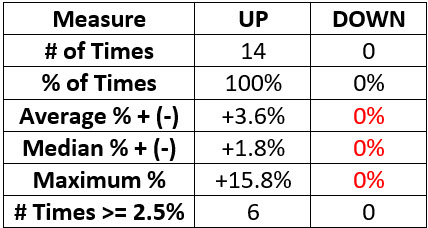
The most obvious characteristic is that HYG has shown a gain 100% of the time during this period, with some gains being significantly large and others relatively small.
VWEHX Seasonality
While we like nothing better than "100%" readings, we also realize that nothing in the market will always be 100% accurate. So, to set a likely more realistic expectation regarding high-yield performance during the seasonally favorable period highlighted above, we ran the same test using total return data for mutual fund ticker VWEHX (Vanguard High-Yield Corporate Fund Investor Shares), which has data going back to 1980. This allows us to look at 42 years of returns rather than just 14 years as with HYG.
The chart below displays the cumulative growth of $1 invested in VWEHX every year starting since 1980 between Trading Day of the Year (TDY) #56 and TDY #84. 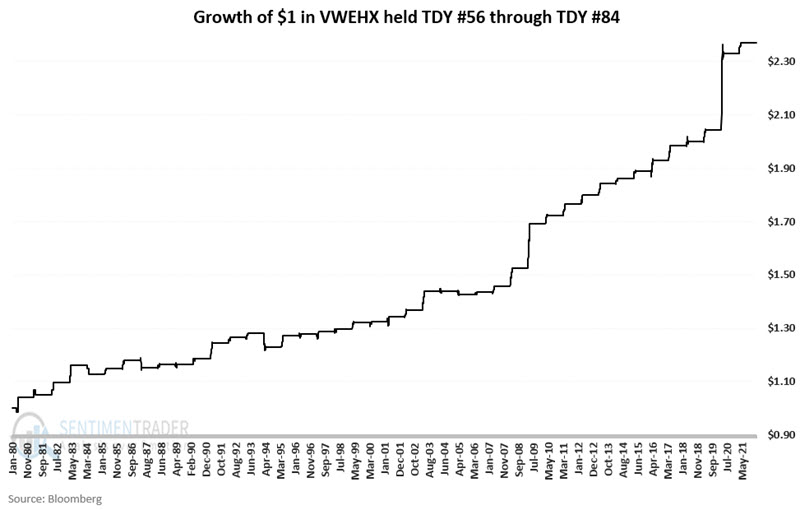
The table below displays a summary of performance.
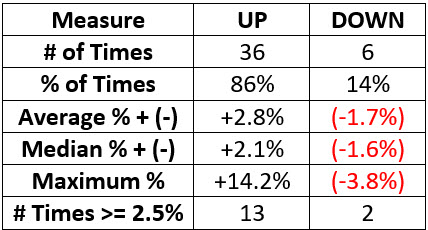
The bad news is that the aura of "invincibility" regarding the HYG results shown above is punctured. The good news is that the returns have been remarkably consistent for over four decades, with a win rate of 86%.
What the research tells us…
An impending favorable seasonal period combined with an oversold signal from the NASDAQ McClellan Summation Index plus an impending bullish reversal from the High Yield Bonds NH - NL indicator strongly suggests that better days should be directly ahead for the high-yield bond sector.
That said, the reality is that there is no guarantee that things will work out this time around as they have in the past. Before jumping in, traders looking to play the high-yield bond sector must still think hard about money management (i.e., position sizing) and risk management (when to cut a loss). They must also accept that things may not work out this time around as they have in the past and be prepared to minimize risk.