
Is there any reason to be bullish - Part 2

Key Points
- The market is slipping into the grip of rampant bearishness
- Bullish signs are beginning to occur "under the radar"
- Some of these signs involve extremes in breadth and corporate insider buying and selling
For Openers
As I explained in Part 1, it is quite possible that we are in a bear market and that, given the second-highest ever peak for the Shiller PE ratio, the bear market could be one of the particularly devastating kinds. As a result, given the fact that all of the market indexes are below their respective 200-day moving average (i.e., in established downtrends), it is important to "play some defense" (for me, defined as holding some cash).
However, when I appeared on Bloomberg TV on 5/20, I referenced one of the best indicators I have come across over the years. This indicator gave a bullish signal on Thursday, May 12th. Several key things to note:
- Each of the previous eight signals saw the Nasdaq 100 rise in the next 12 months
- The average 12-month gain was an eye-opening +42.9%
- However, the average Nasdaq 100 decline from the time of the signal to the actual bottom was -6% to -8% - typically in a fairly short (and very harrowing) period of time
- The significant outlier occurred in October 2008, which took 33 days from signal to actual low, during which time the Nasdaq declined over -26%. Likewise, the broader market took almost five months to bottom out in March 2009. A possible repeat of this type of scenario cannot be ruled out this time around
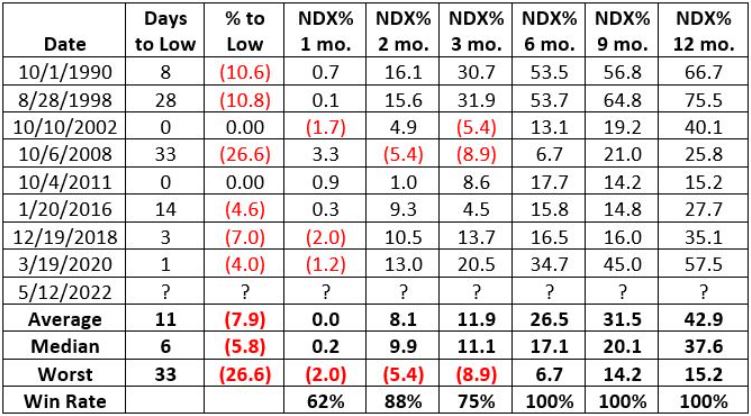
The bottom line: The indicator suggests that a short, sharp plunge in the market in the near term would set the stage for a significant reversal. Here's hoping. Also, in Part 1, I highlighted five favorable signals. Here in Part 2, let's highlight five more.
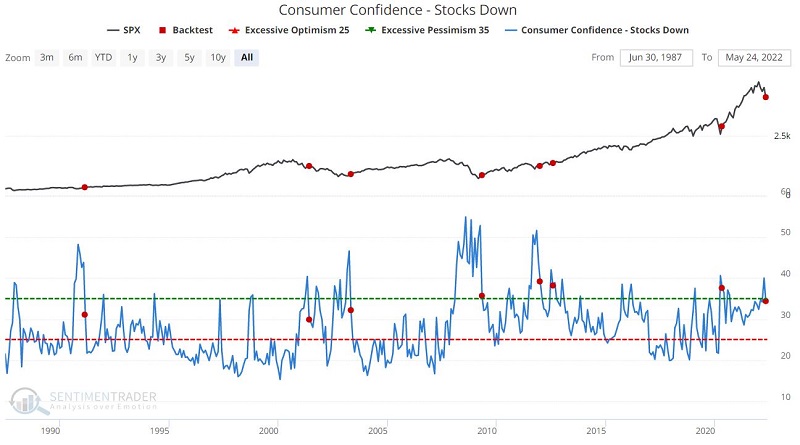
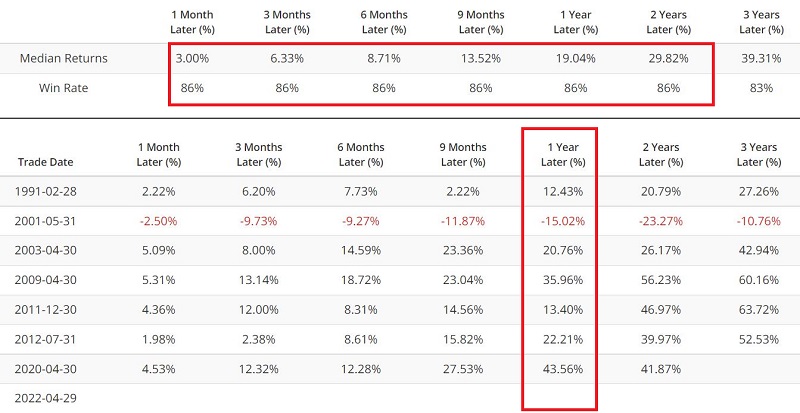
#1. Consumer Confidence - Stocks Down
The chart below shows all days when the Consumer Confidence - Stocks Down indicator dropped below 39.9. The table below that displays the summary of the results.
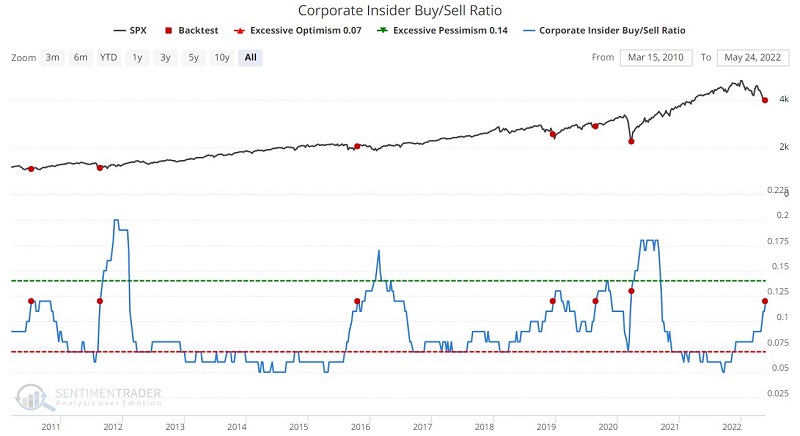
#2. Corporate Insider Buy/Sell Ratio
The chart below shows all days when the Corporate Insider Buy/Sell Ratio indicator crossed above 0.119 for the first time in 4 months. The table below that displays the summary of the results.
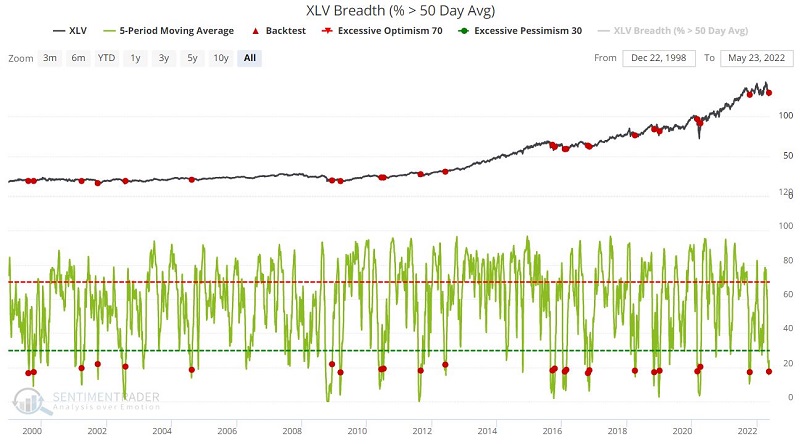
#3. XLV Breadth (% > 50 Day Avg)
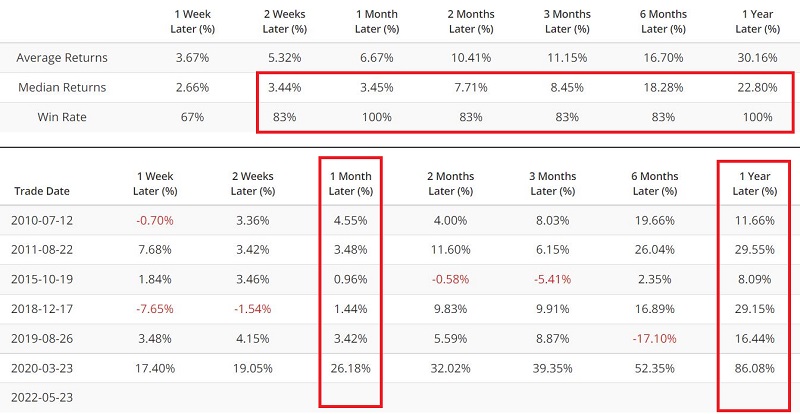
Now let's look at some specific sector indicators. This one involves the health care sector, using ticker XLV as a proxy. The chart below shows all days when the 5-day average of XLV Breadth (% > 50 Day Avg) indicator crossed above 0.16. The table below that displays the summary of the results.
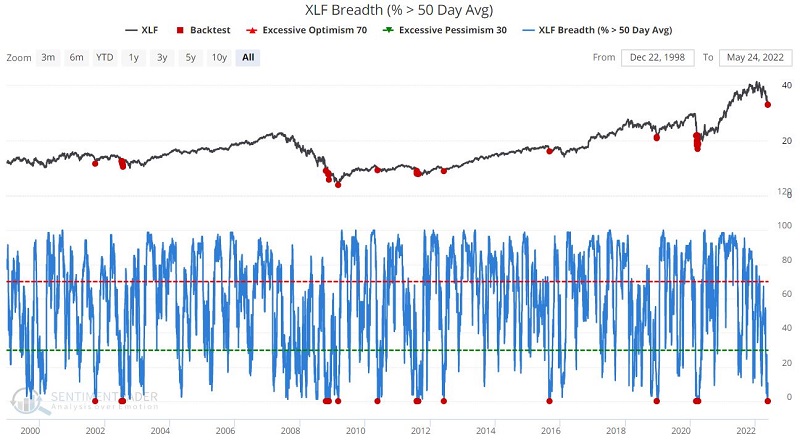
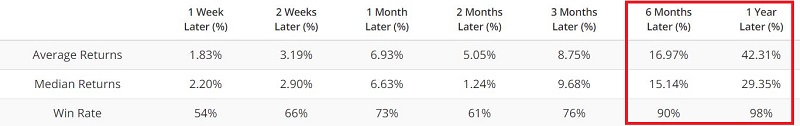
#4. XLF Breadth (% > 50 Day Avg)
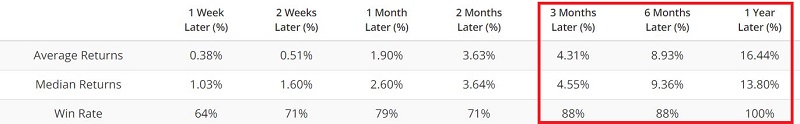
This one involves the financial sector, using ticker XLF as a proxy. The chart below shows all days when the 5-day average of XLF Breadth (% > 50 Day Avg) indicator dropped to 0. The table below that displays the summary of the results.
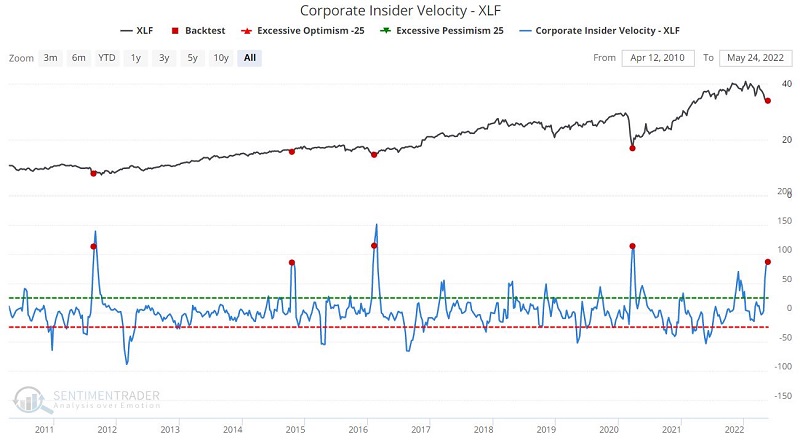
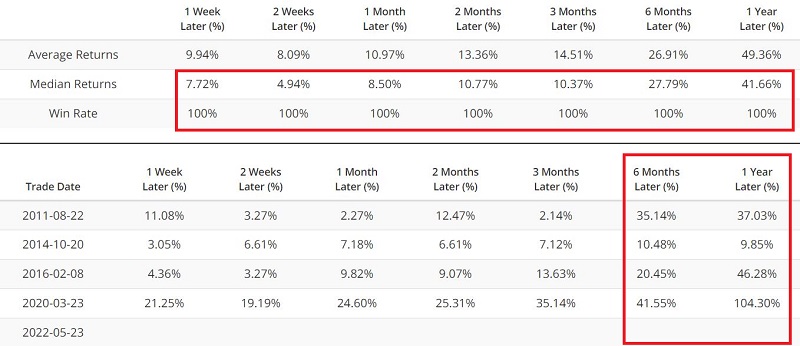
#5. Corporate Insider Buy/Sell Velocity - XLF
This indicator compares the 4-week change in insider buying to the 4-week change in insider selling to glean information regarding significant shifts in insider sentiment. The chart below shows all days when Corporate Insider Buy/Sell Velocity - XLF crossed above 85.
What the research tells us…
The good news is that there are a large number of highly bullish signals taking place. The bad news is that it may be more accurate to say that many "typically" bullish signals are taking place. There is never any guarantee that any signal or group of signals will "work" the next time around. The primary concern is that during bear markets like 2000-2002 and 2007-2009, many purportedly bullish indicators get overwhelmed by other primary bearish factors. The jury remains "out" on the current decline. Inflation, rising interest rates, high valuation, and a potentially slowing economy may force the market much lower.
Nevertheless, investors must remember that reversals occur when the majority "throw in the towel" and give in to rampantly bearish sentiment. Investors who are still fully invested are right to be highly concerned that things may get much worse. However, investors with cash to invest - now more than ever - should remain alert to the possibility of a strong reversal and rally in the weeks and months ahead.