
Is there any reason to be bullish? Part 1

Key Points
- Believe it or not, the economy is still objectively favorable (although that can change as early as June 1)
- Price action, inflation, interest rates, and seasonality are all "unfavorable" at the moment - thus, some reasonable size of caution appears to be in order
- Based on market action following previous high peaks in valuation (1929 and 2000), "yes," there is significant potential downside risk (however, valuation is not a "timing" tool)
- Energy stocks and commodities continue to trend higher (and may continue to do so for some time)
- Many historically reliable indicators are flashing green of late (this suggests the potential for a surprisingly strong rally in stocks in the months ahead)
The Big Picture
First, let's spell a few things out: First and foremost - I am not an investment advisor, and Sentimentrader.com does not dispense specific investment advice. Our job is to provide research designed to give you an "edge" in the markets. Depending on your style, risk tolerance level, and whether you are a short-term trader or a longer-term investor, different pieces of research that we detail may strike your fancy to a lesser or greater degree. Everything I say about how I see the market is mere "food for thought."
With that in mind:
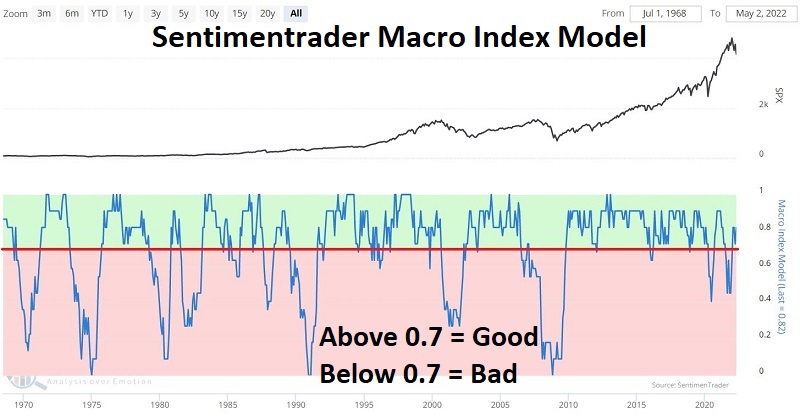
The indicators that I follow are net bearish. I follow two recession probability models - my own "back of the envelope" figuring and the much more accurate Macro Index Model - both are still saying roughly 20% probability of recession. That can change quickly, but for now, the rules rank them as "favorable."
Beyond that, price action, inflation, interest rates, and seasonality are all "unfavorable." One more point: Note in the chart below the major peaks in the Shiller PE ratio and the stock market's action following these peaks. Note that the second-highest reading ever occurred at last year's peak. 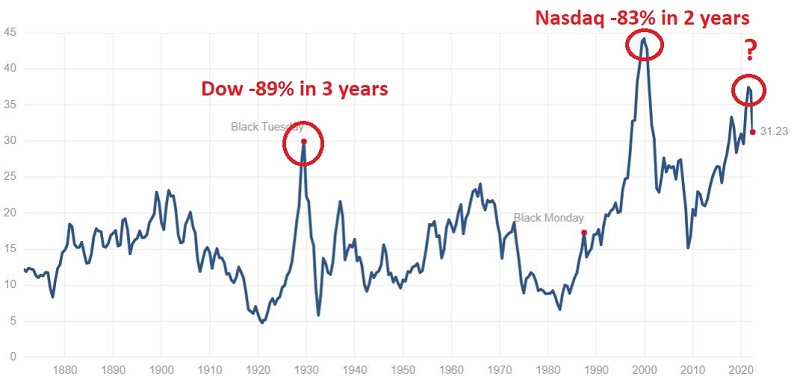
Remember that valuation is a "perspective" tool and not a "timing" tool. The key takeaway for me is this: Under no circumstances am I personally willing to ride the next bear market (whether the recent decline is the beginning of it or not) to the bottom fully invested.
The model I follow for investing incorporates specific trend-following techniques - and several strategies that can switch to cash/bonds/commodities and 10% discretion - all designed to scale risk exposure up or down depending on price action.
At the moment (again, this is not a "recommendation" but merely one guy's thinking), the allocation is:
50% stocks: Certain sectors and dividend-paying stocks (energy and a dividend portfolio I tweeted on January 4 are up for the year; health care and staples are down roughly -9% versus -18% for SPX)
20% commodities: Have been terrific but likely due for a pullback. The chart below displays the Bloomberg Commodity Index versus the S&P 500 Index. 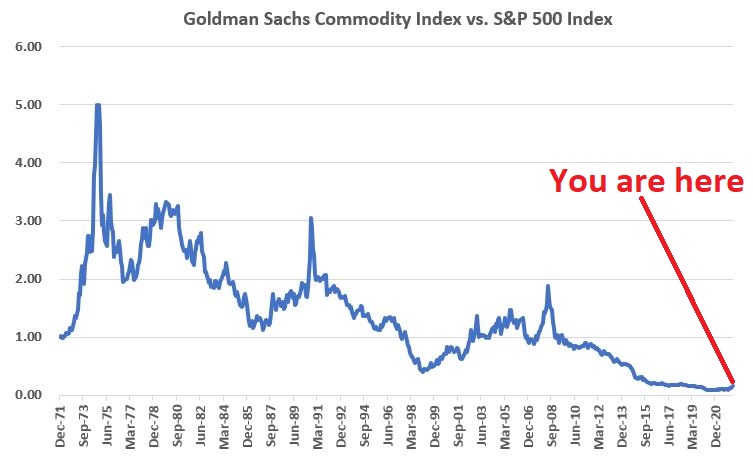
Based on "reversion to the mean," commodities may continue to outperform stocks for several to many years. Commodity ETFs such as PDBC, GSG, DJP, and GCC allows investors to participate in a basket of commodities without trading commodity futures.
30% cash: Not making much with interest rates low. But can make more as rates rise. It also leaves money to invest when the outlook improves (and is much better than -18% for the S&P 500 YTD.
So, I cannot be categorized as a "raging bull" by any means. Nevertheless, even if we are in an actual bear market, there can and will be sizeable (i.e., no reason not to try to make money during them) rallies along the way.
When I appeared on Bloomberg TV on 5/20, the question of the day was, "Is there any reason to be bullish?" I referenced one of the best indicators I have come across over the years.
Here are five other recent bullish signals.
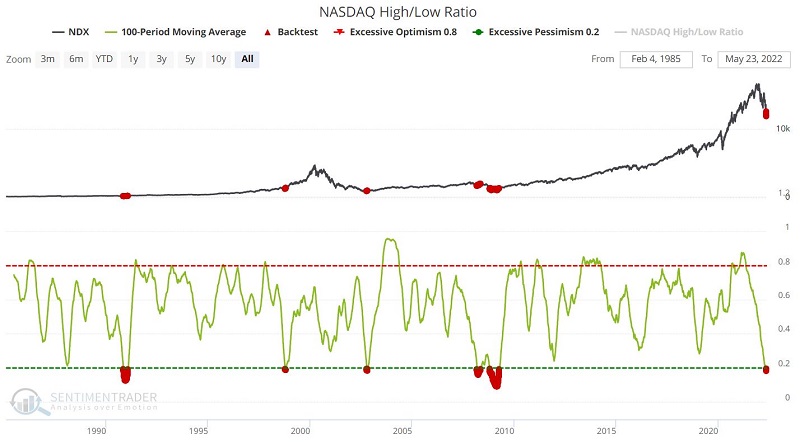
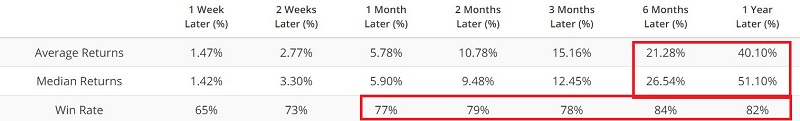
#1. Nasdaq Hi/Low Ratio - Part 1
The chart below shows all days when the 100-day moving average of the Nasdaq Hi/Lo Ratio was below 0.20. The table below that displays a summary of the results.
#2. Nasdaq Hi/Low Ratio - Part 2
The chart below shows all days when the 3-day moving average of the Nasdaq Hi/Lo Ratio was below 0.02. The table below that displays a summary of the results.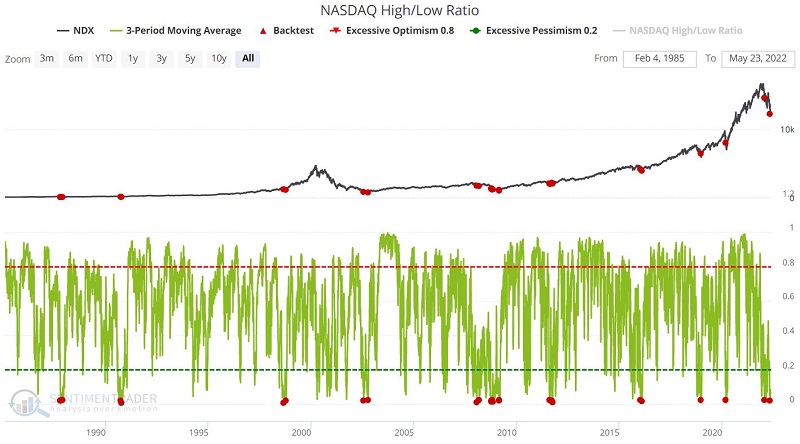
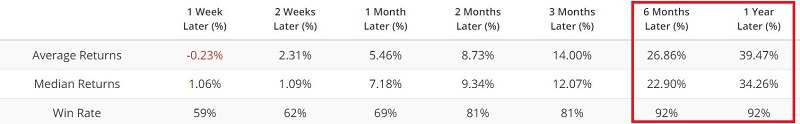
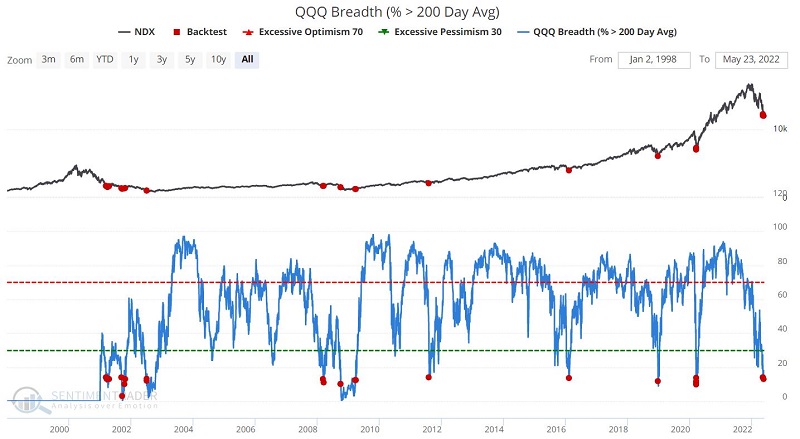
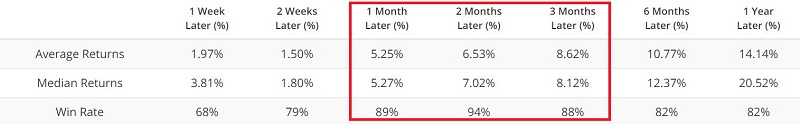
#3. QQQ Breadth (% > 200-day Avg.)
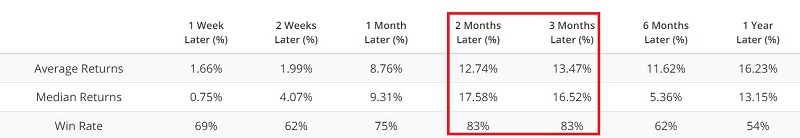
I highlighted this one, but it bears repeating. The chart below shows all days when the QQQ Breath (% > 200-day Avg) crossed below 14. The table below that displays a summary of the results.
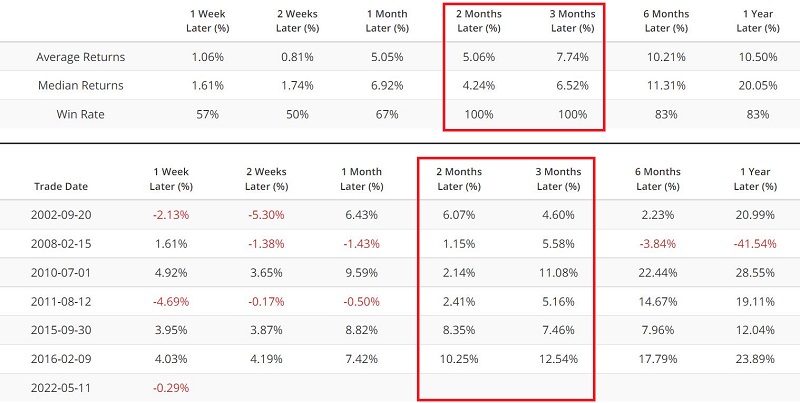
#4. S&P 500 versus Risk On/Risk Off
The chart below shows the performance of the S&P 500 Index when our Risk On/Risk Off indicator crossed below 4.9 for the first time in three months. The table below that displays a summary of the results.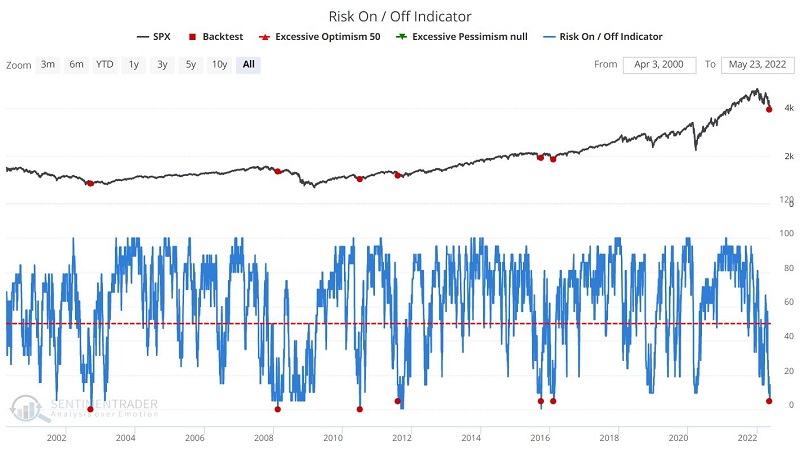
#5. Intermediate-Term Optimistic Index
The chart below shows the performance of the S&P 500 Index when our Intermediate-Term Optimism Index was below 20 for the first time in 21 days. The table below that displays a summary of the results.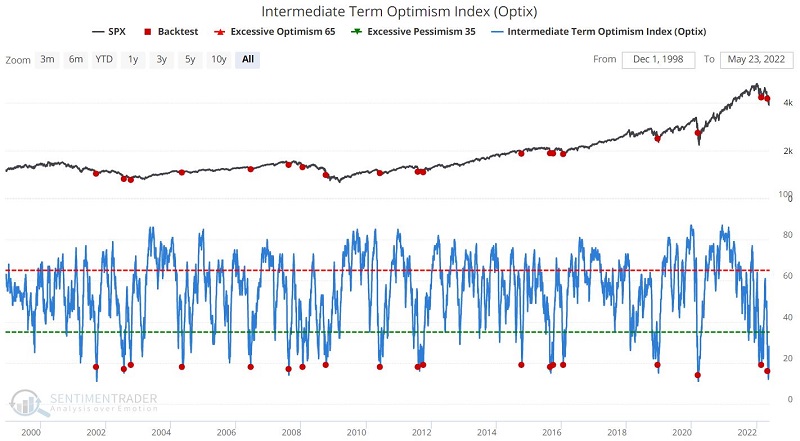
What the research tells us…
Anything is always a possibility in the stock market. So when the primary method you use is primarily bearish and historical valuations suggest that long-term downside risk may be huge, what do you do? What you do is up to you. What I do is scale down the risk exposure (hence the 30% in cash detailed earlier) so as not to inadvertently ride a worse than expected decline to the bottom fully invested. It's not my personality to be always 100% in or 100% out - another reason I prefer to scale in and out.
The mantra I've always liked regarding allocations in the market is "There's always a bull market somewhere." Our job as investors is to find that bull market and then have the nerve to jump aboard. High tech/Large-cap/Momentum stocks enjoyed a heck of a run following the Covid low in 2020. And it was not exactly unknown - one just had to have the nerve to jump aboard (Hint: human nature being what it is, it's not as easy as it sounds - but it is still the thing to do). Last year those categories started to lose their edge. Since then, the energy sector has been a huge performer, and a lot of dividend-paying (mostly) lower volatility stocks have garnered good gains in 2022, despite the awful overall nature of the market.
What do you do - if anything - when you practically have to go underground to view the relationship between commodities and stocks? Again, what you do is up to you. I allocate some portion of the portfolio to commodities (without betting the ranch due to the volatile nature of commodities).
And what do you do when many typically reliable indicators begin to turn favorable at once? The first thing is to note the use of the word "typically" and remind yourself that:
a) Something that is 80% to 90% accurate will still be wrong 10% to 20% of the time
b) You have to decide how you will protect yourself if you act, and this turns out to be one of those 10% to 20% of the times (Hint: Shrugging your shoulders, facing your palms up, and intoning "This thing is 80% accurate and this time its getting killed - how can I be so unlucky?" DOES NOT qualify as a valid risk-mitigating response).
c) Even the worst bear markets experience significant rallies along the way - and there is nothing wrong with increasing exposure to profit from them - so long as you remember to reduce risk when the rally loses steam.