
Is There a Shift in the Offense and Defense Between Technology and Finance?

Key points:
- Amid market expectations, investors are rotating from technology to financials
- The Technology/Financials Ratio (XLK/XLF Ratio) has plummeted from a 42-day high to a 42-day low within two months
- The 9-month standard deviation of the ratio between the two sectors has rapidly dropped from a 3-month high to a 3-month low
Capital Flows Undergo a Shift
In the final weeks of late 2025, the market appears to be experiencing sector rotation. As shown in the curves in the figures below, capital is exiting the technology sector while pouring into the financial sector.
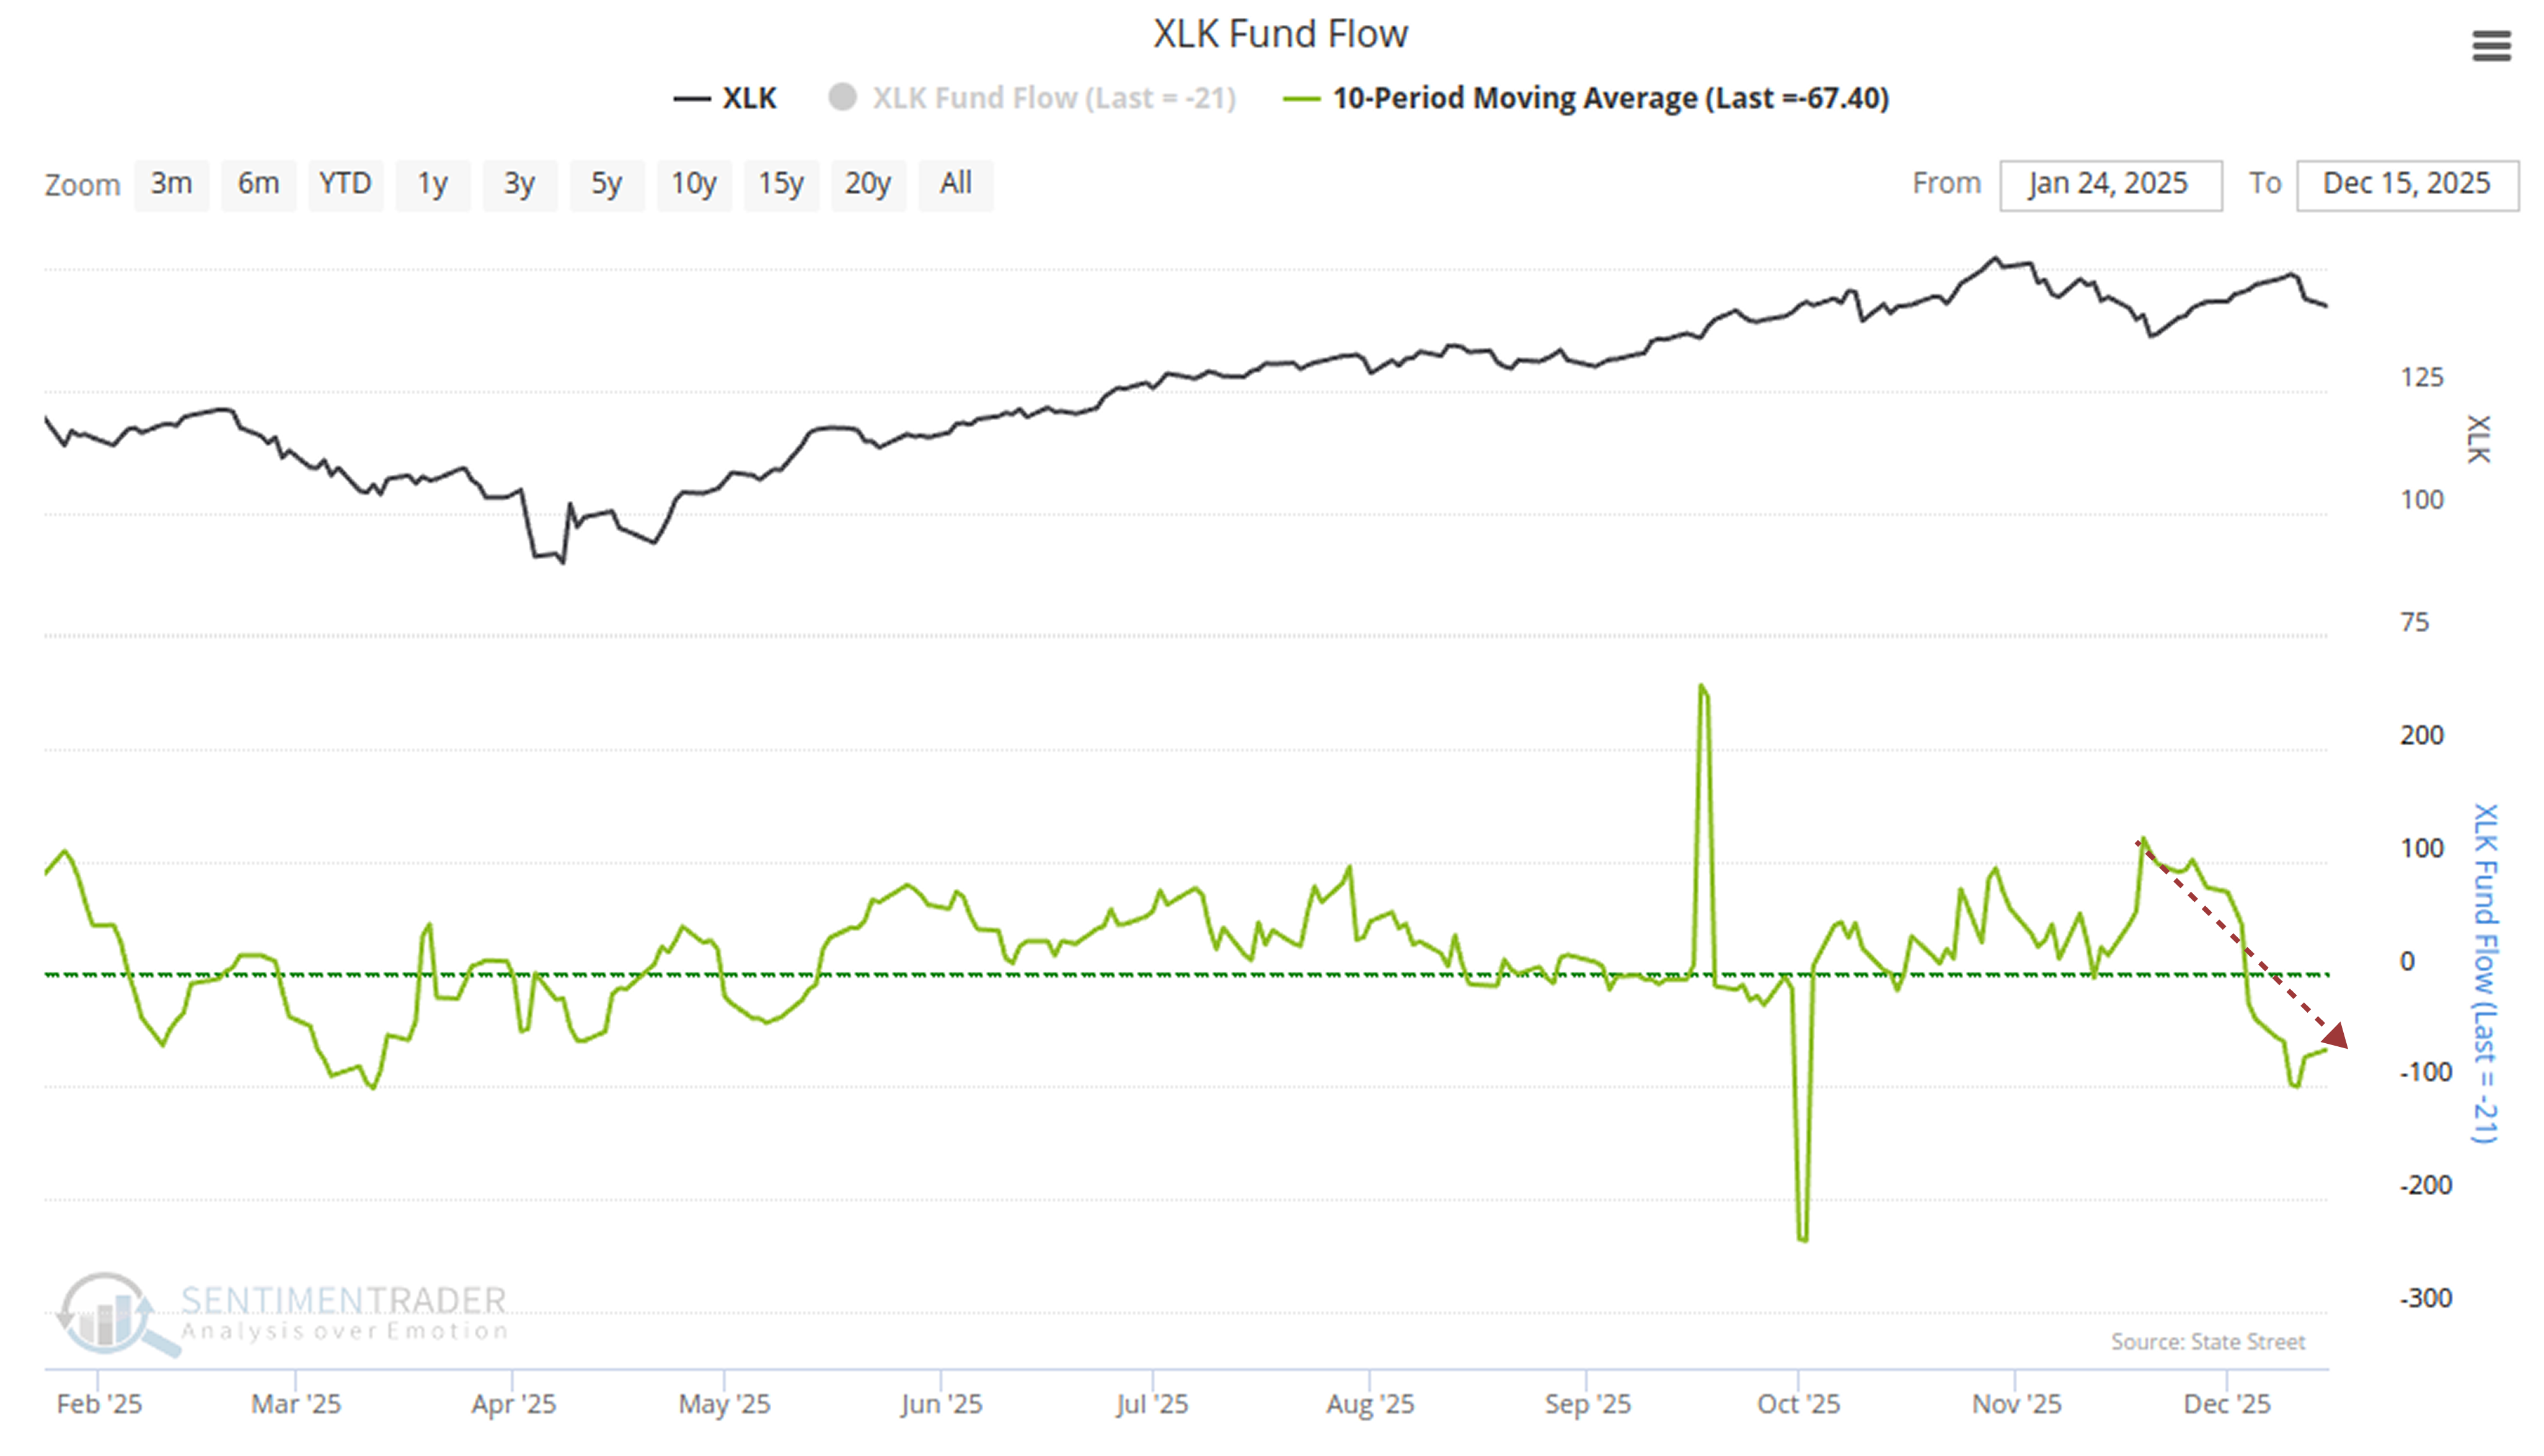
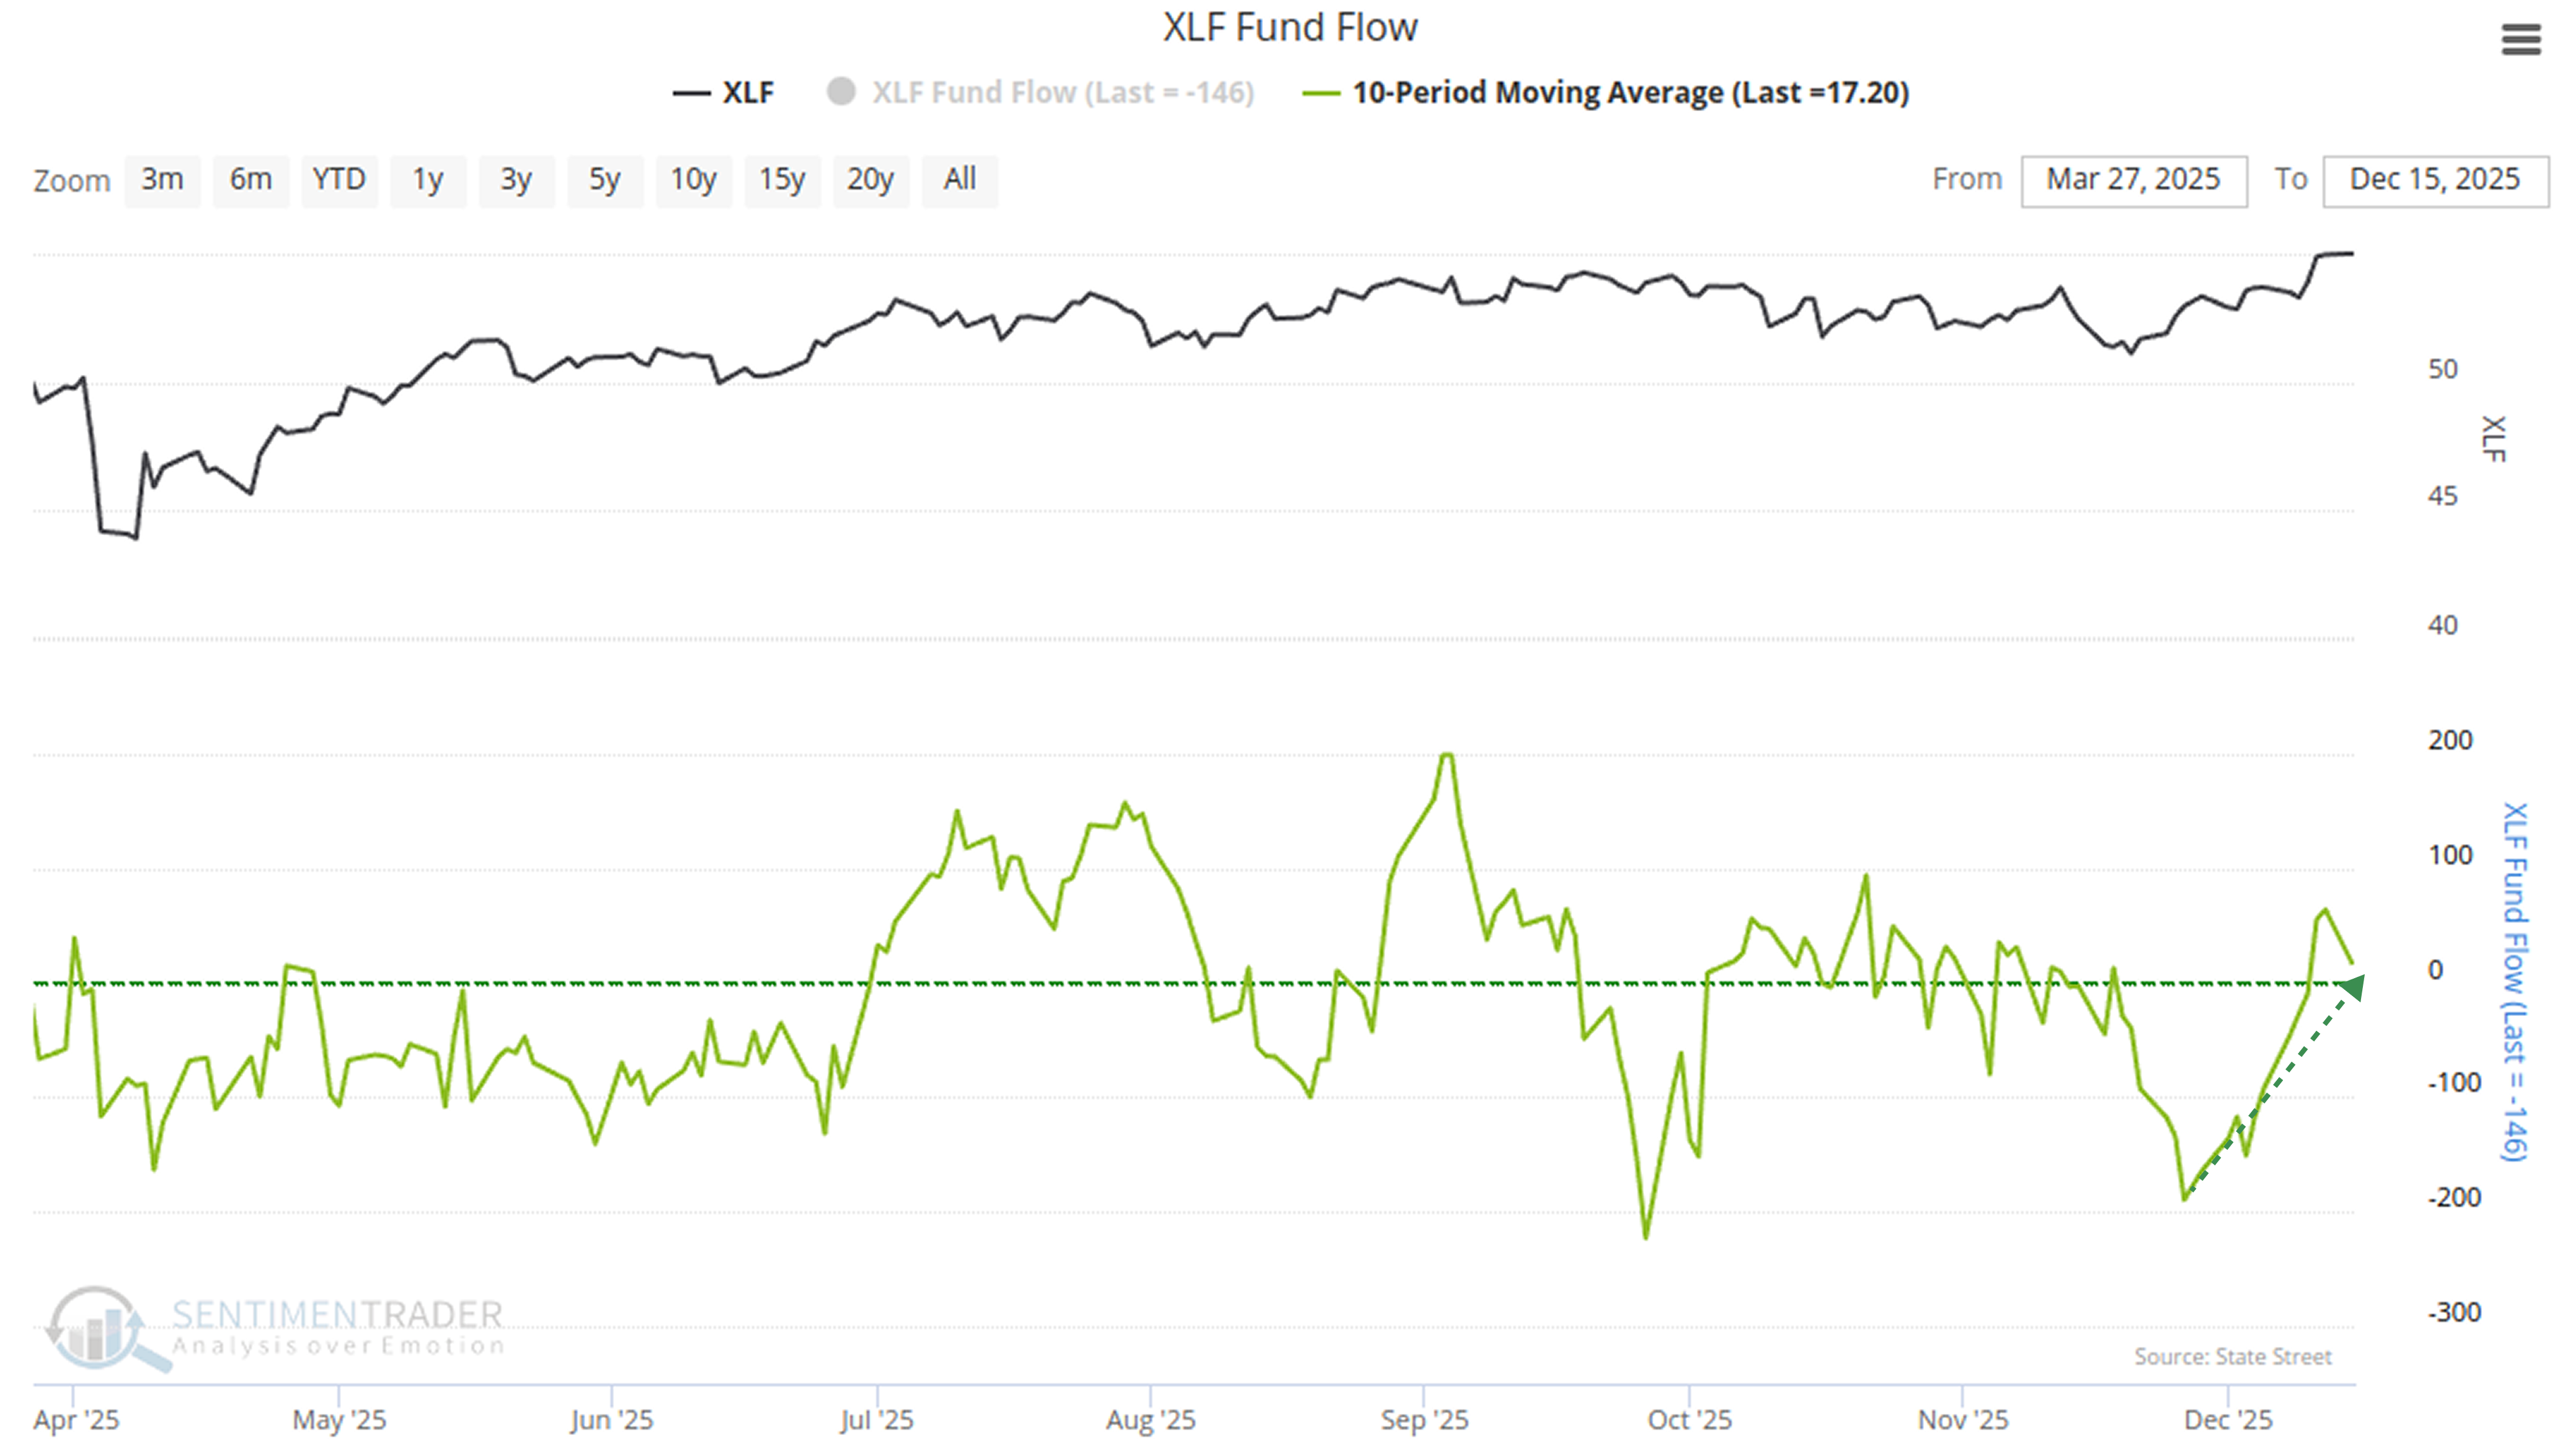
Against this backdrop, the performance of the corresponding sectors has diverged. The price ratio between them is also reversing. Investor preference for the technology sector seems to have cooled, with interest instead shifting to financials.
Price Rotation Between Financial and Technology Stocks
The chart below shows the ratio of XLK (technology stocks) to XLF (financial stocks) closing prices. This ratio can be created using our My Indicator feature. It can be seen that this ratio reversed sharply within two months (42 trading days), falling from a 42-day high to a 42-day low.Related Backtest Click Here.
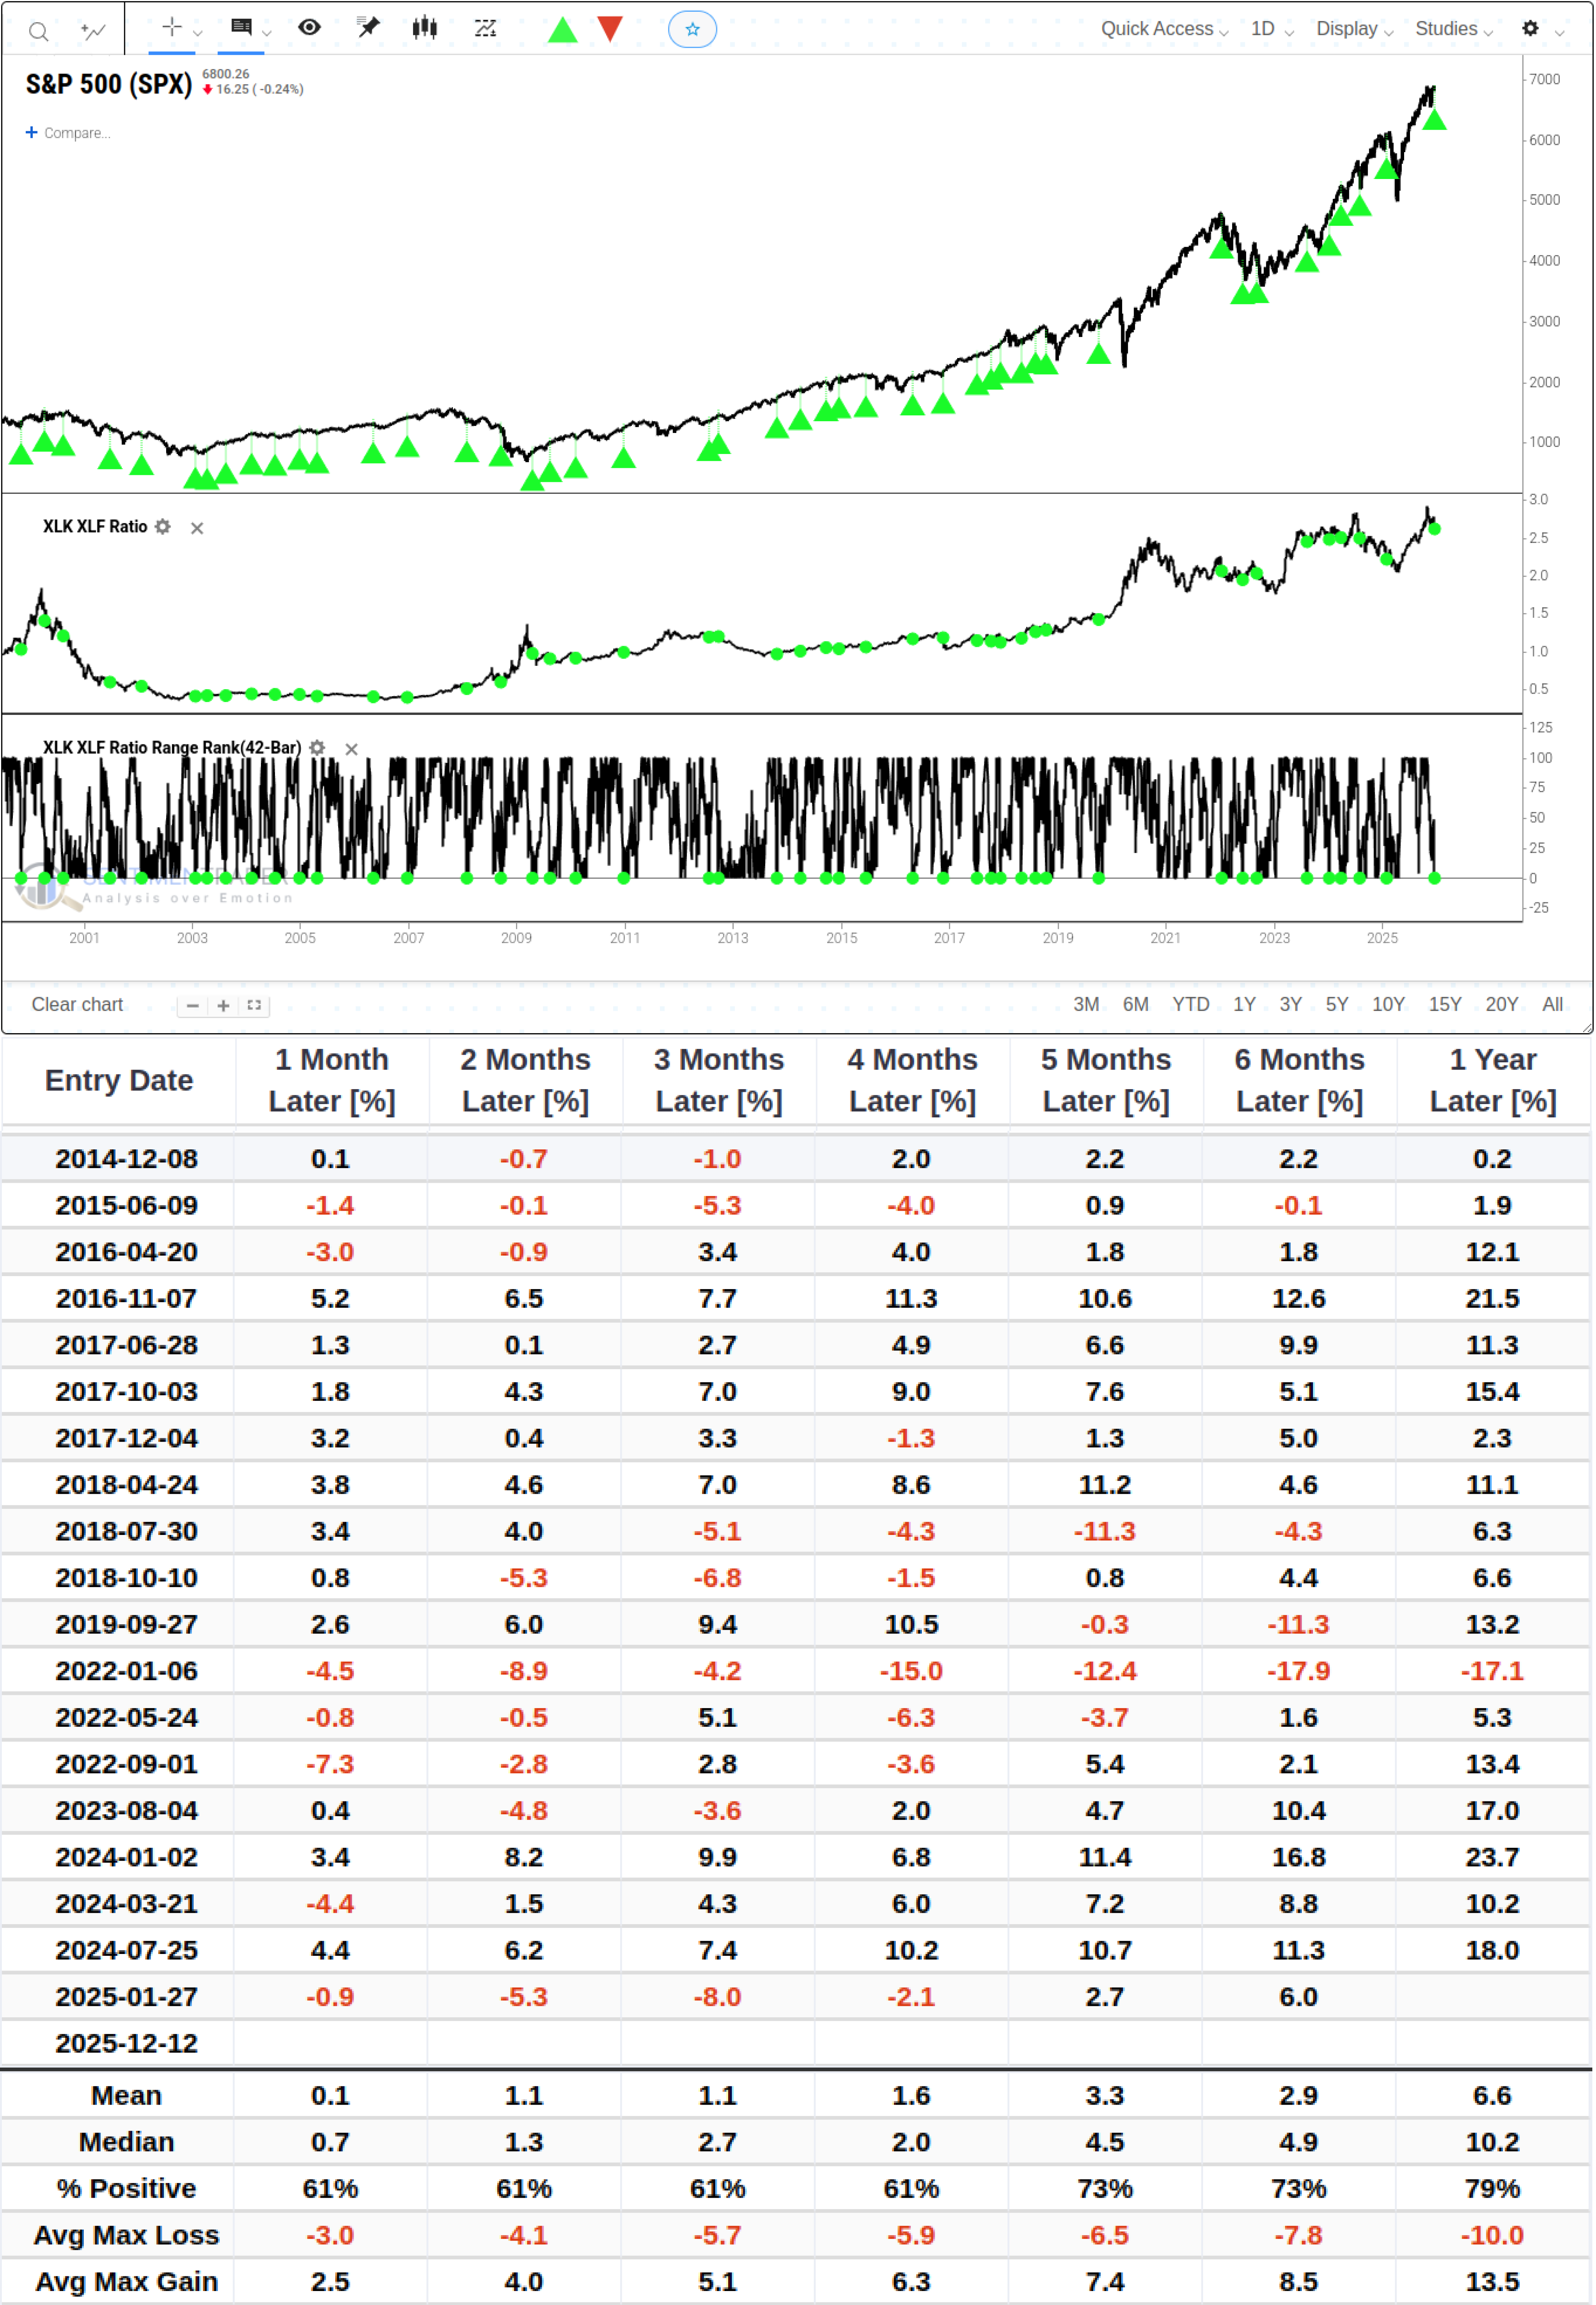
Due to image length limitations, a total of 45 signals display data from the most recent 20 signals. From a data perspective, this signal shows no standout performance in the S&P 500 Index.
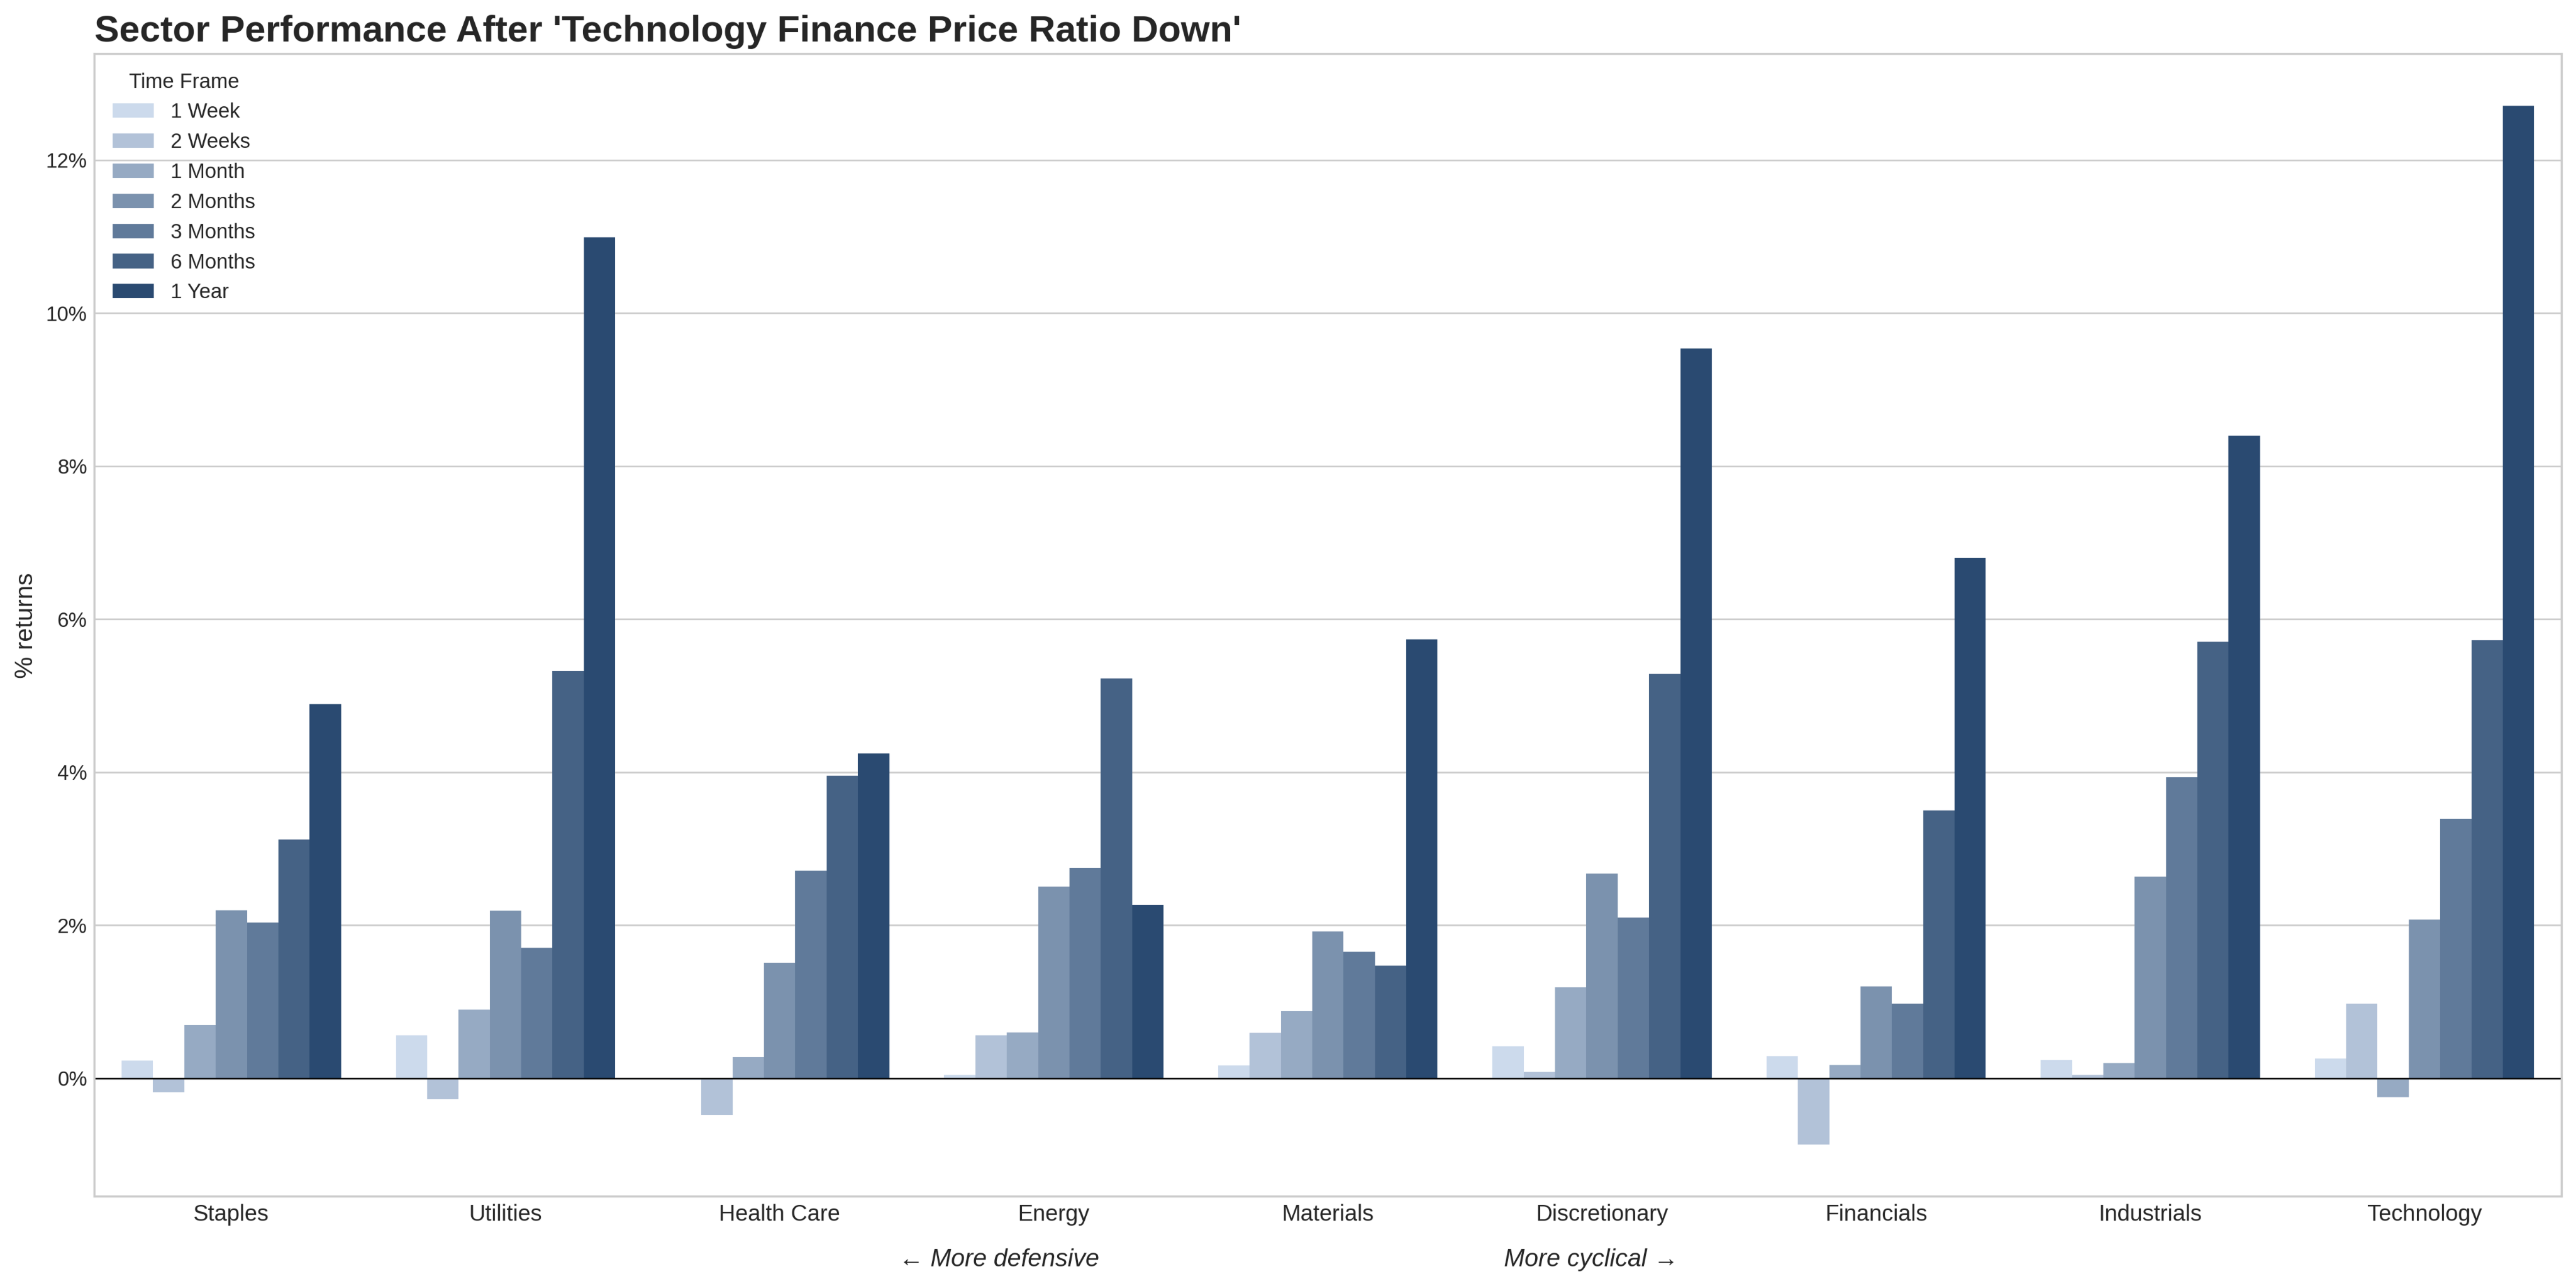
Shifting the focus to other sectors, historical data indicates that such signals triggered by the relative strength of financial stocks do not typically herald the start of long-cycle excess returns. On the contrary, one year after the signal is triggered, the median return of the financial sector (+6.8%) usually lags behind that of the technology sector (+12.7%), which is at the center of market movements.
Deeper Analysis
To filter out the interference of long-term trends, we further observed the Z-Score (standard score) based on the 9-month trend. The deviation represents the current ratio's distance from the average state over the past 9 months, measured in standard deviations. As shown in the figure, the Z-Score of XLK/XLF reached an extreme high above 2.0 in early November, meaning the premium of technology stocks relative to financial stocks once deviated by more than 2 standard deviations from the long-term average.
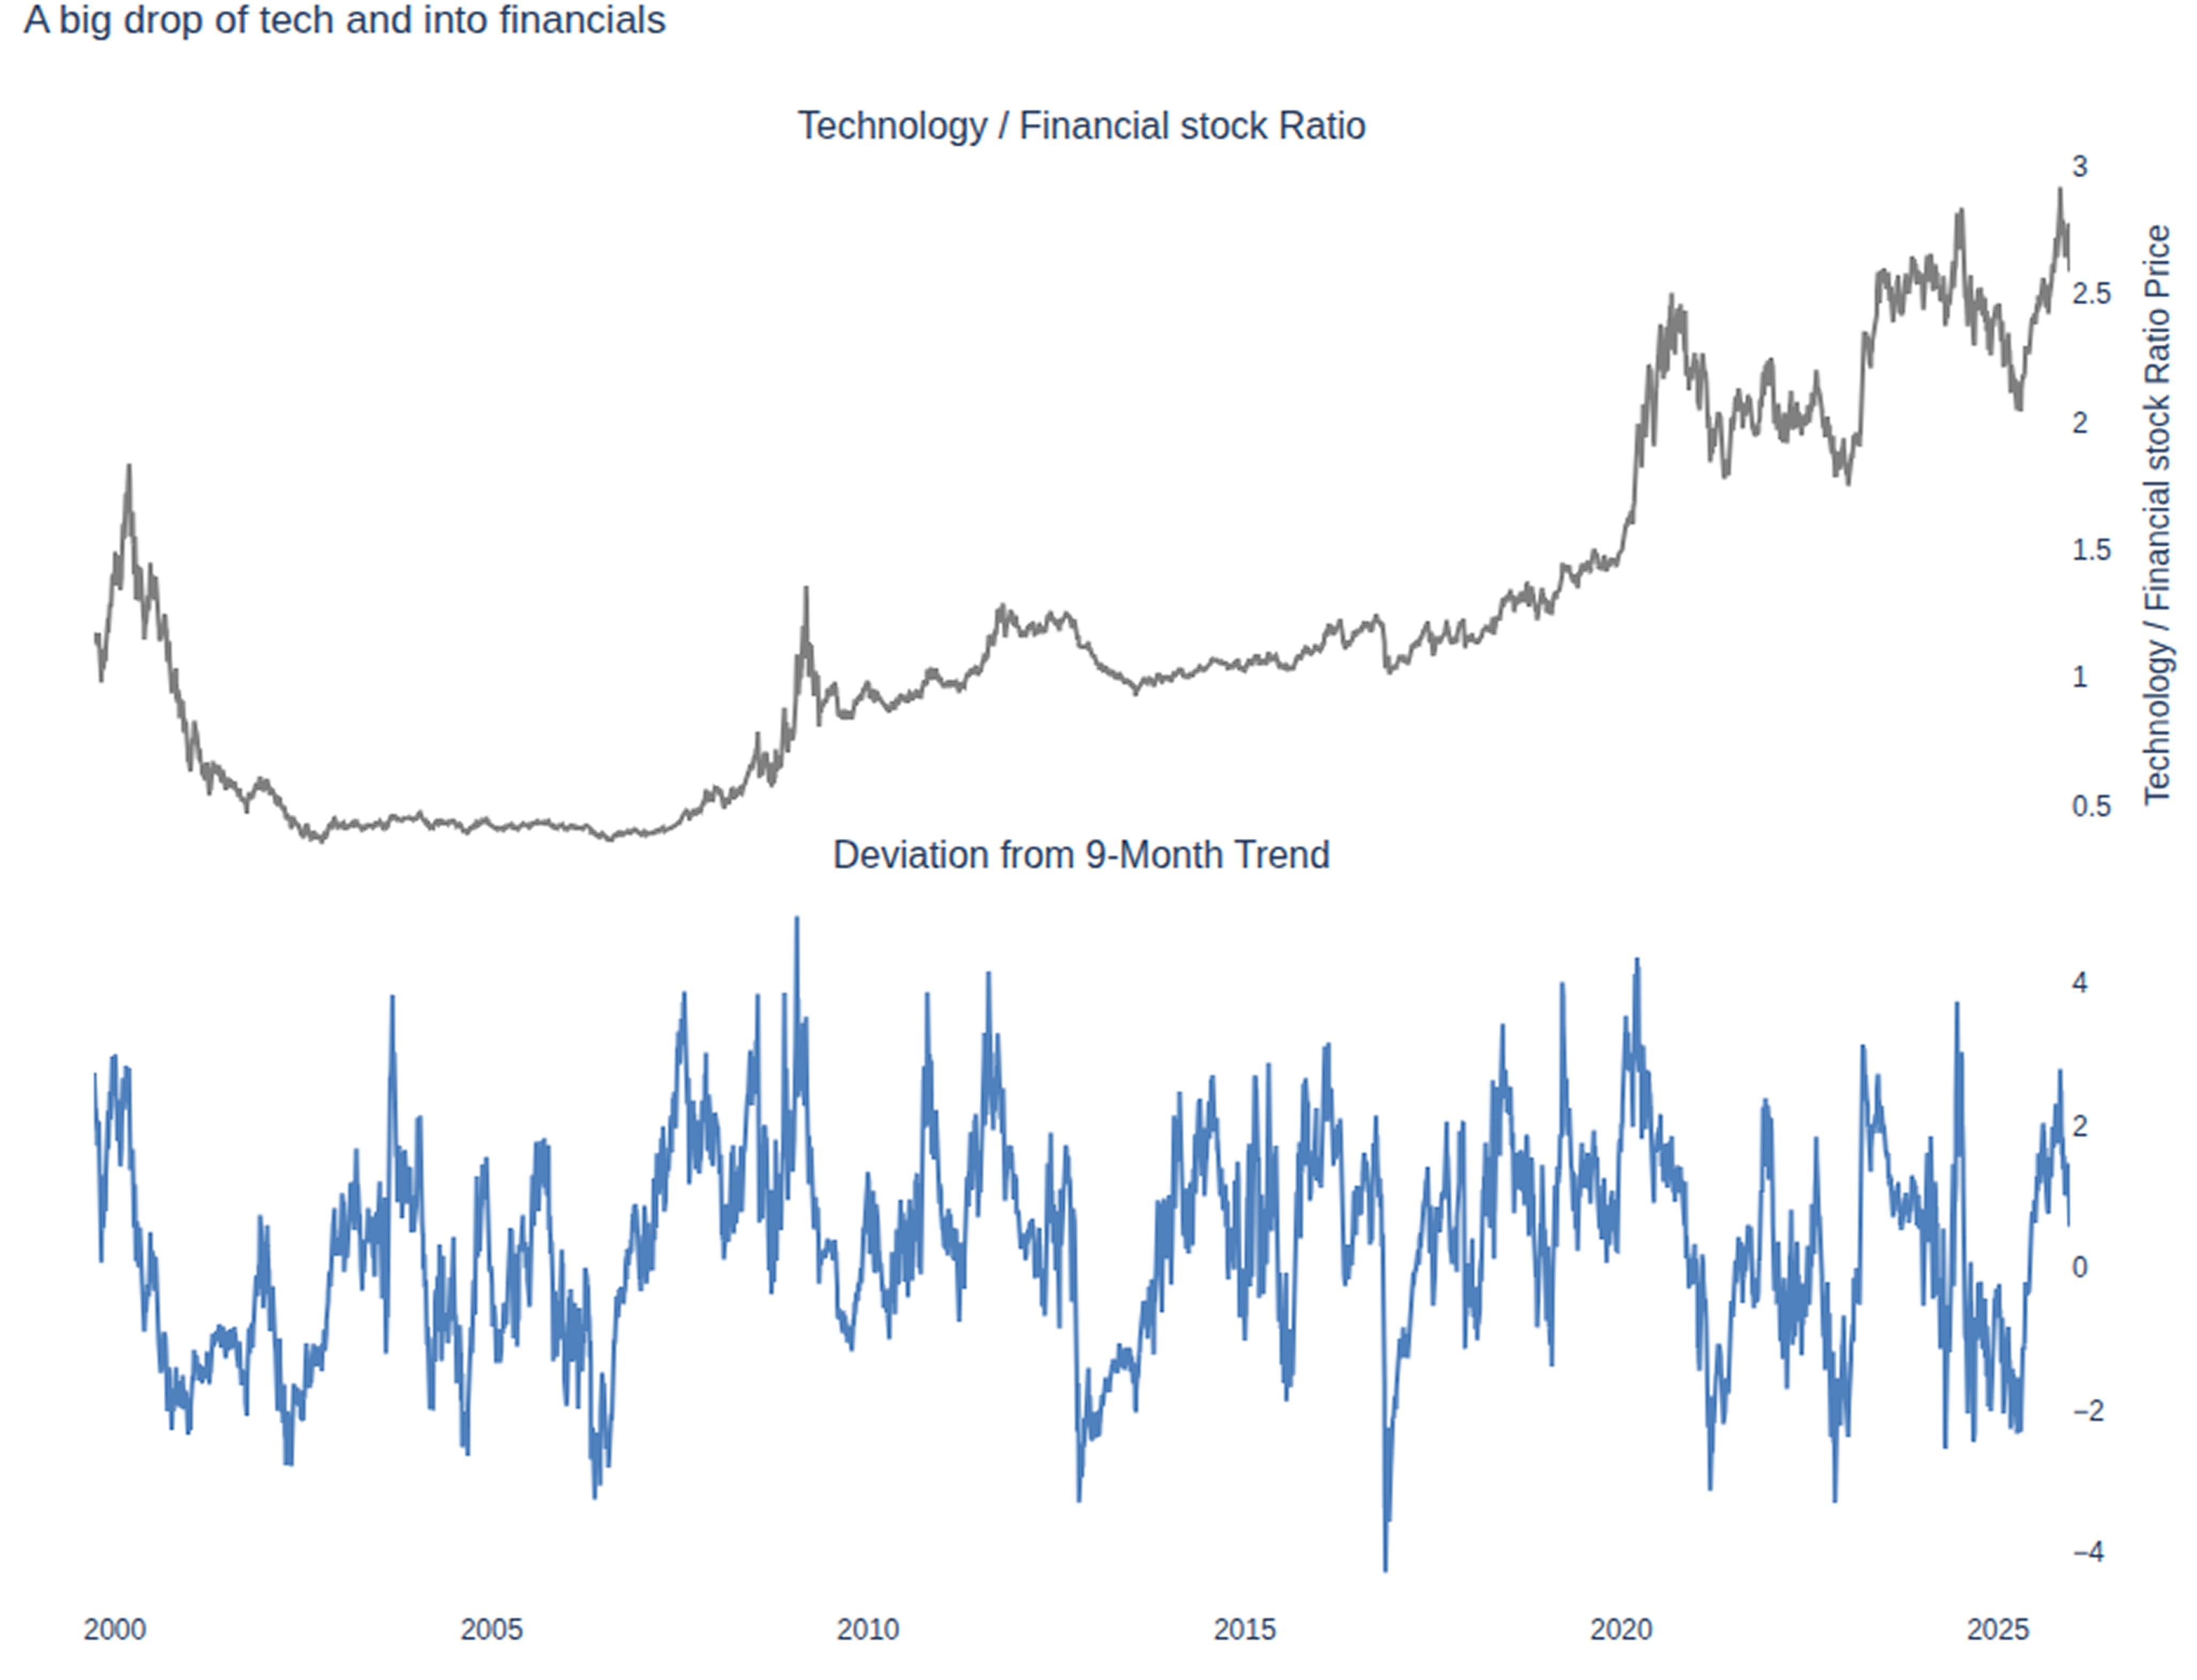
Currently, this indicator has quickly fallen back to around 0.5. While it has not yet touched the extreme oversold territory of -2.0, the speed of this decline (Velocity) warrants caution.Related Backtest Click Here.
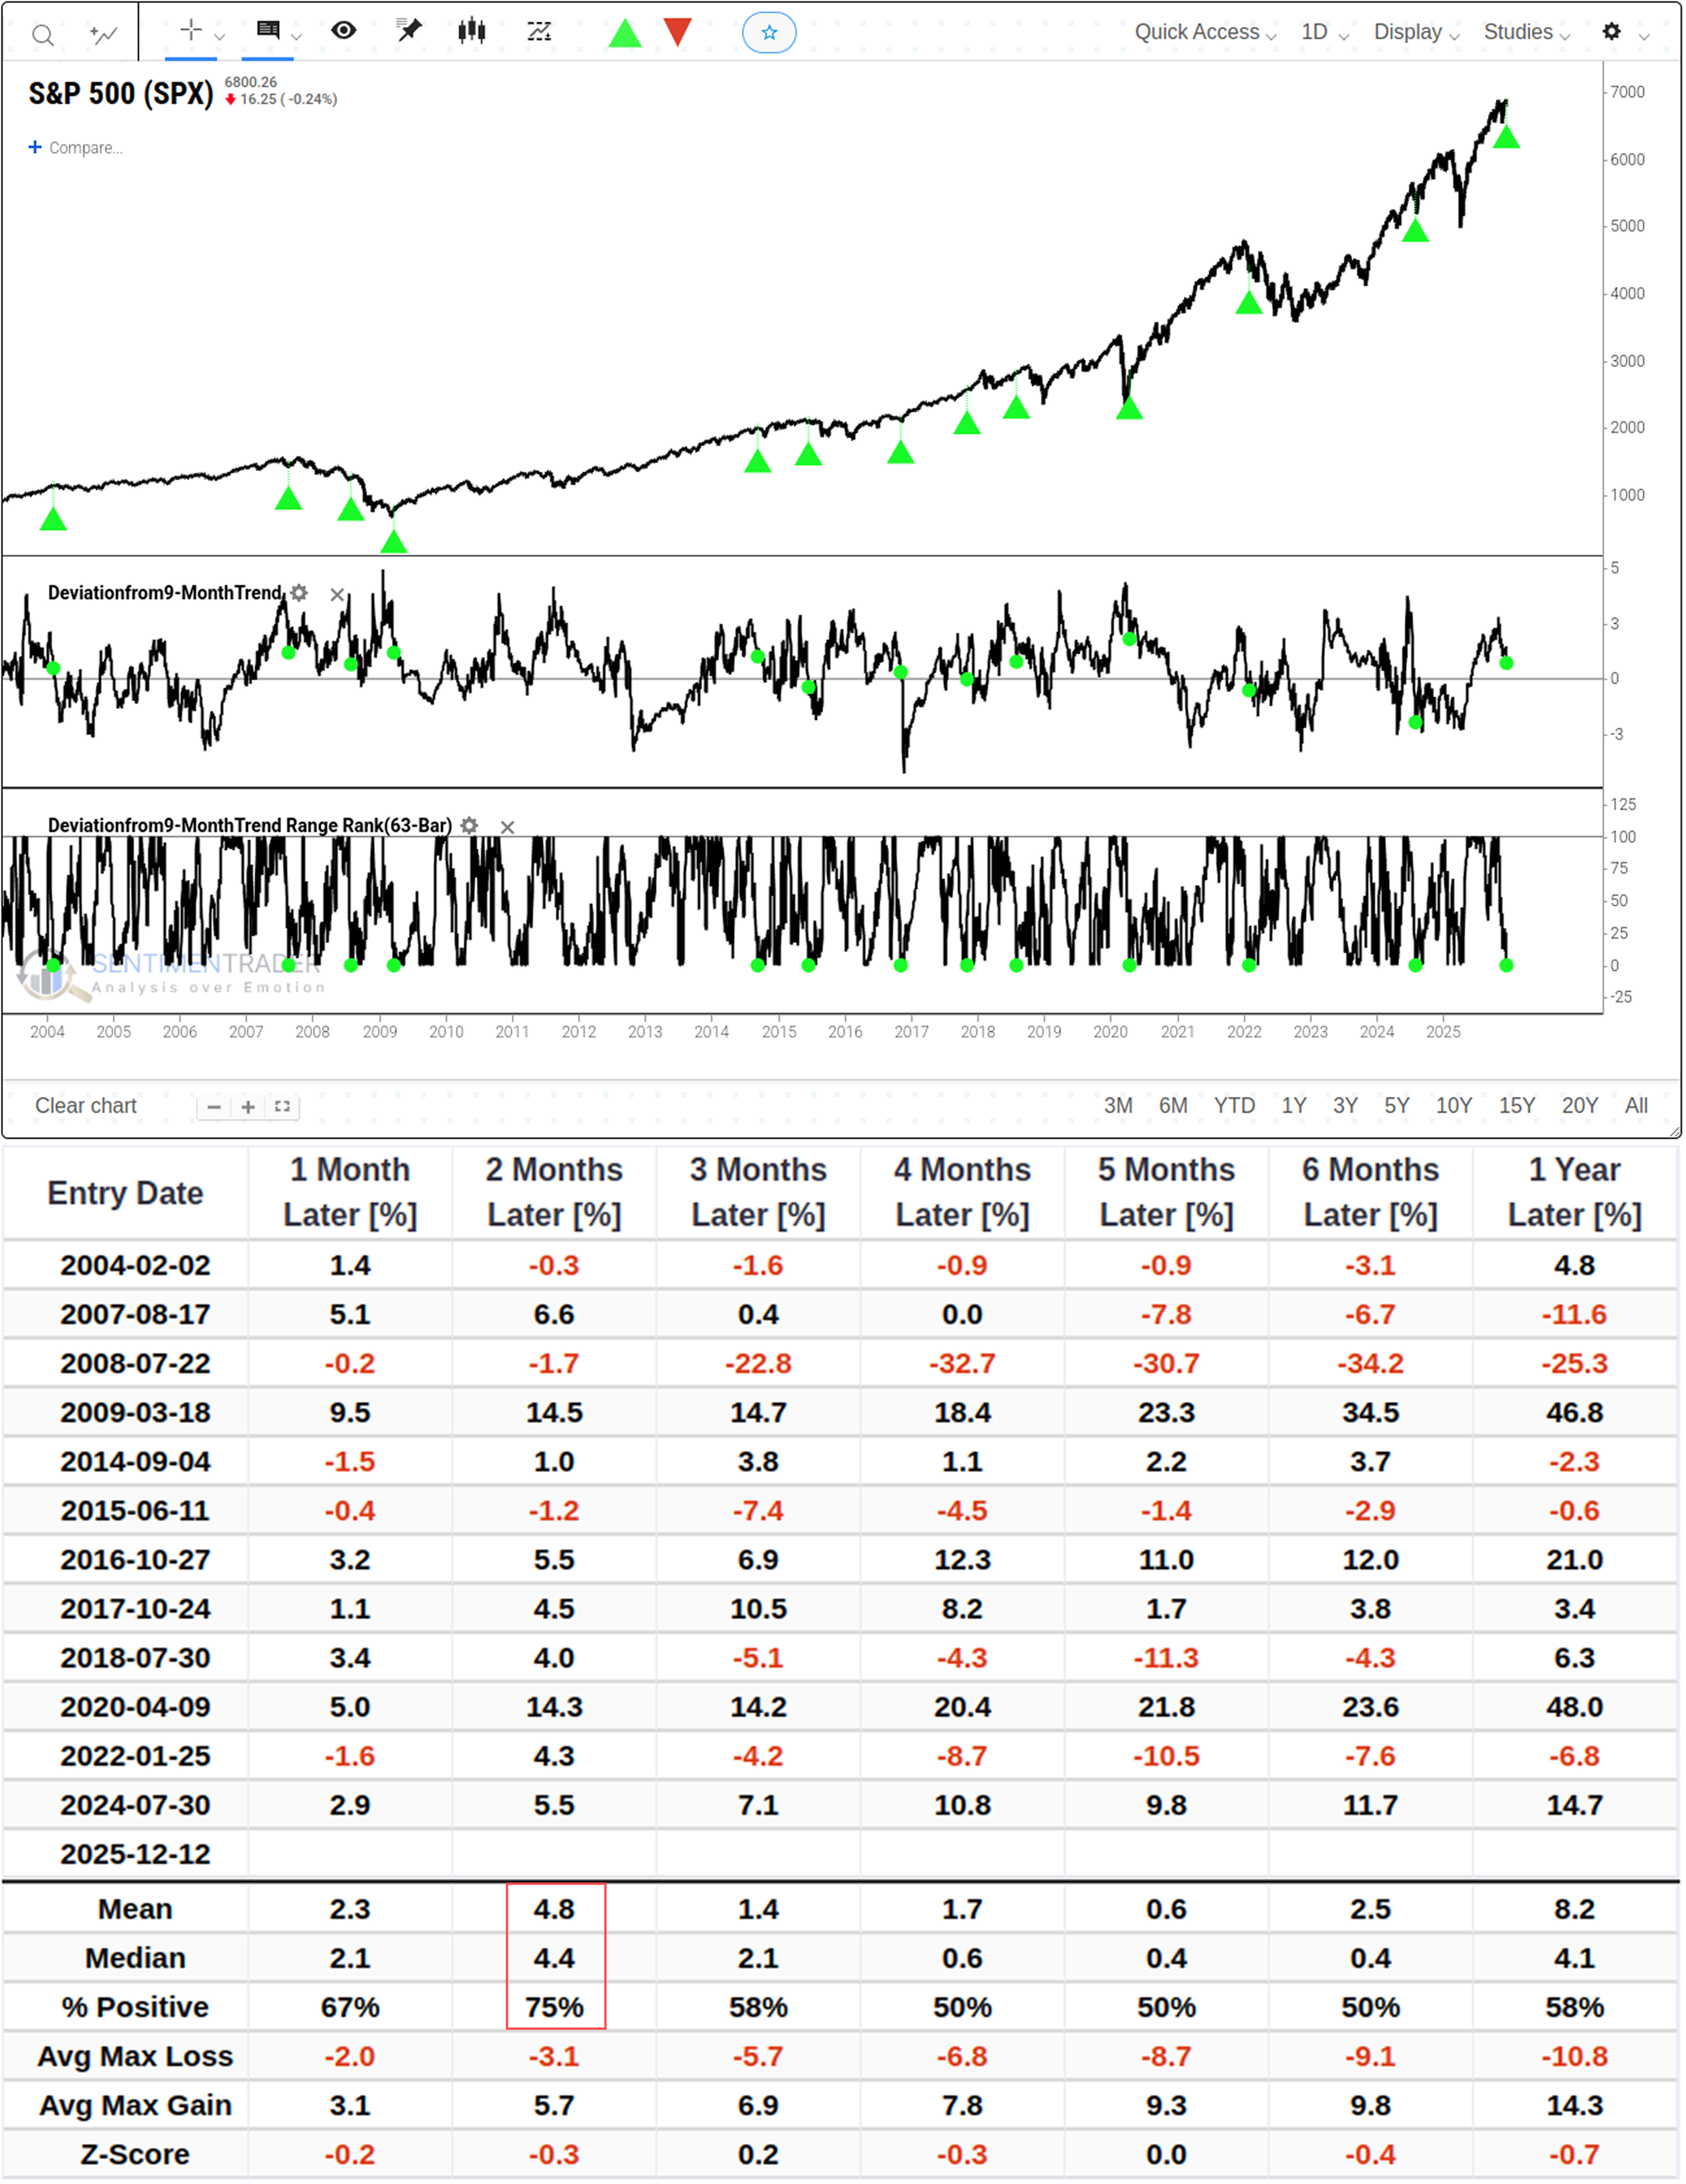
Whether this will impact the broader market remains debatable. However, data shows that the S&P 500 has a 75% win rate after two months, while returns are mostly of a coin-flip style in other timeframes.
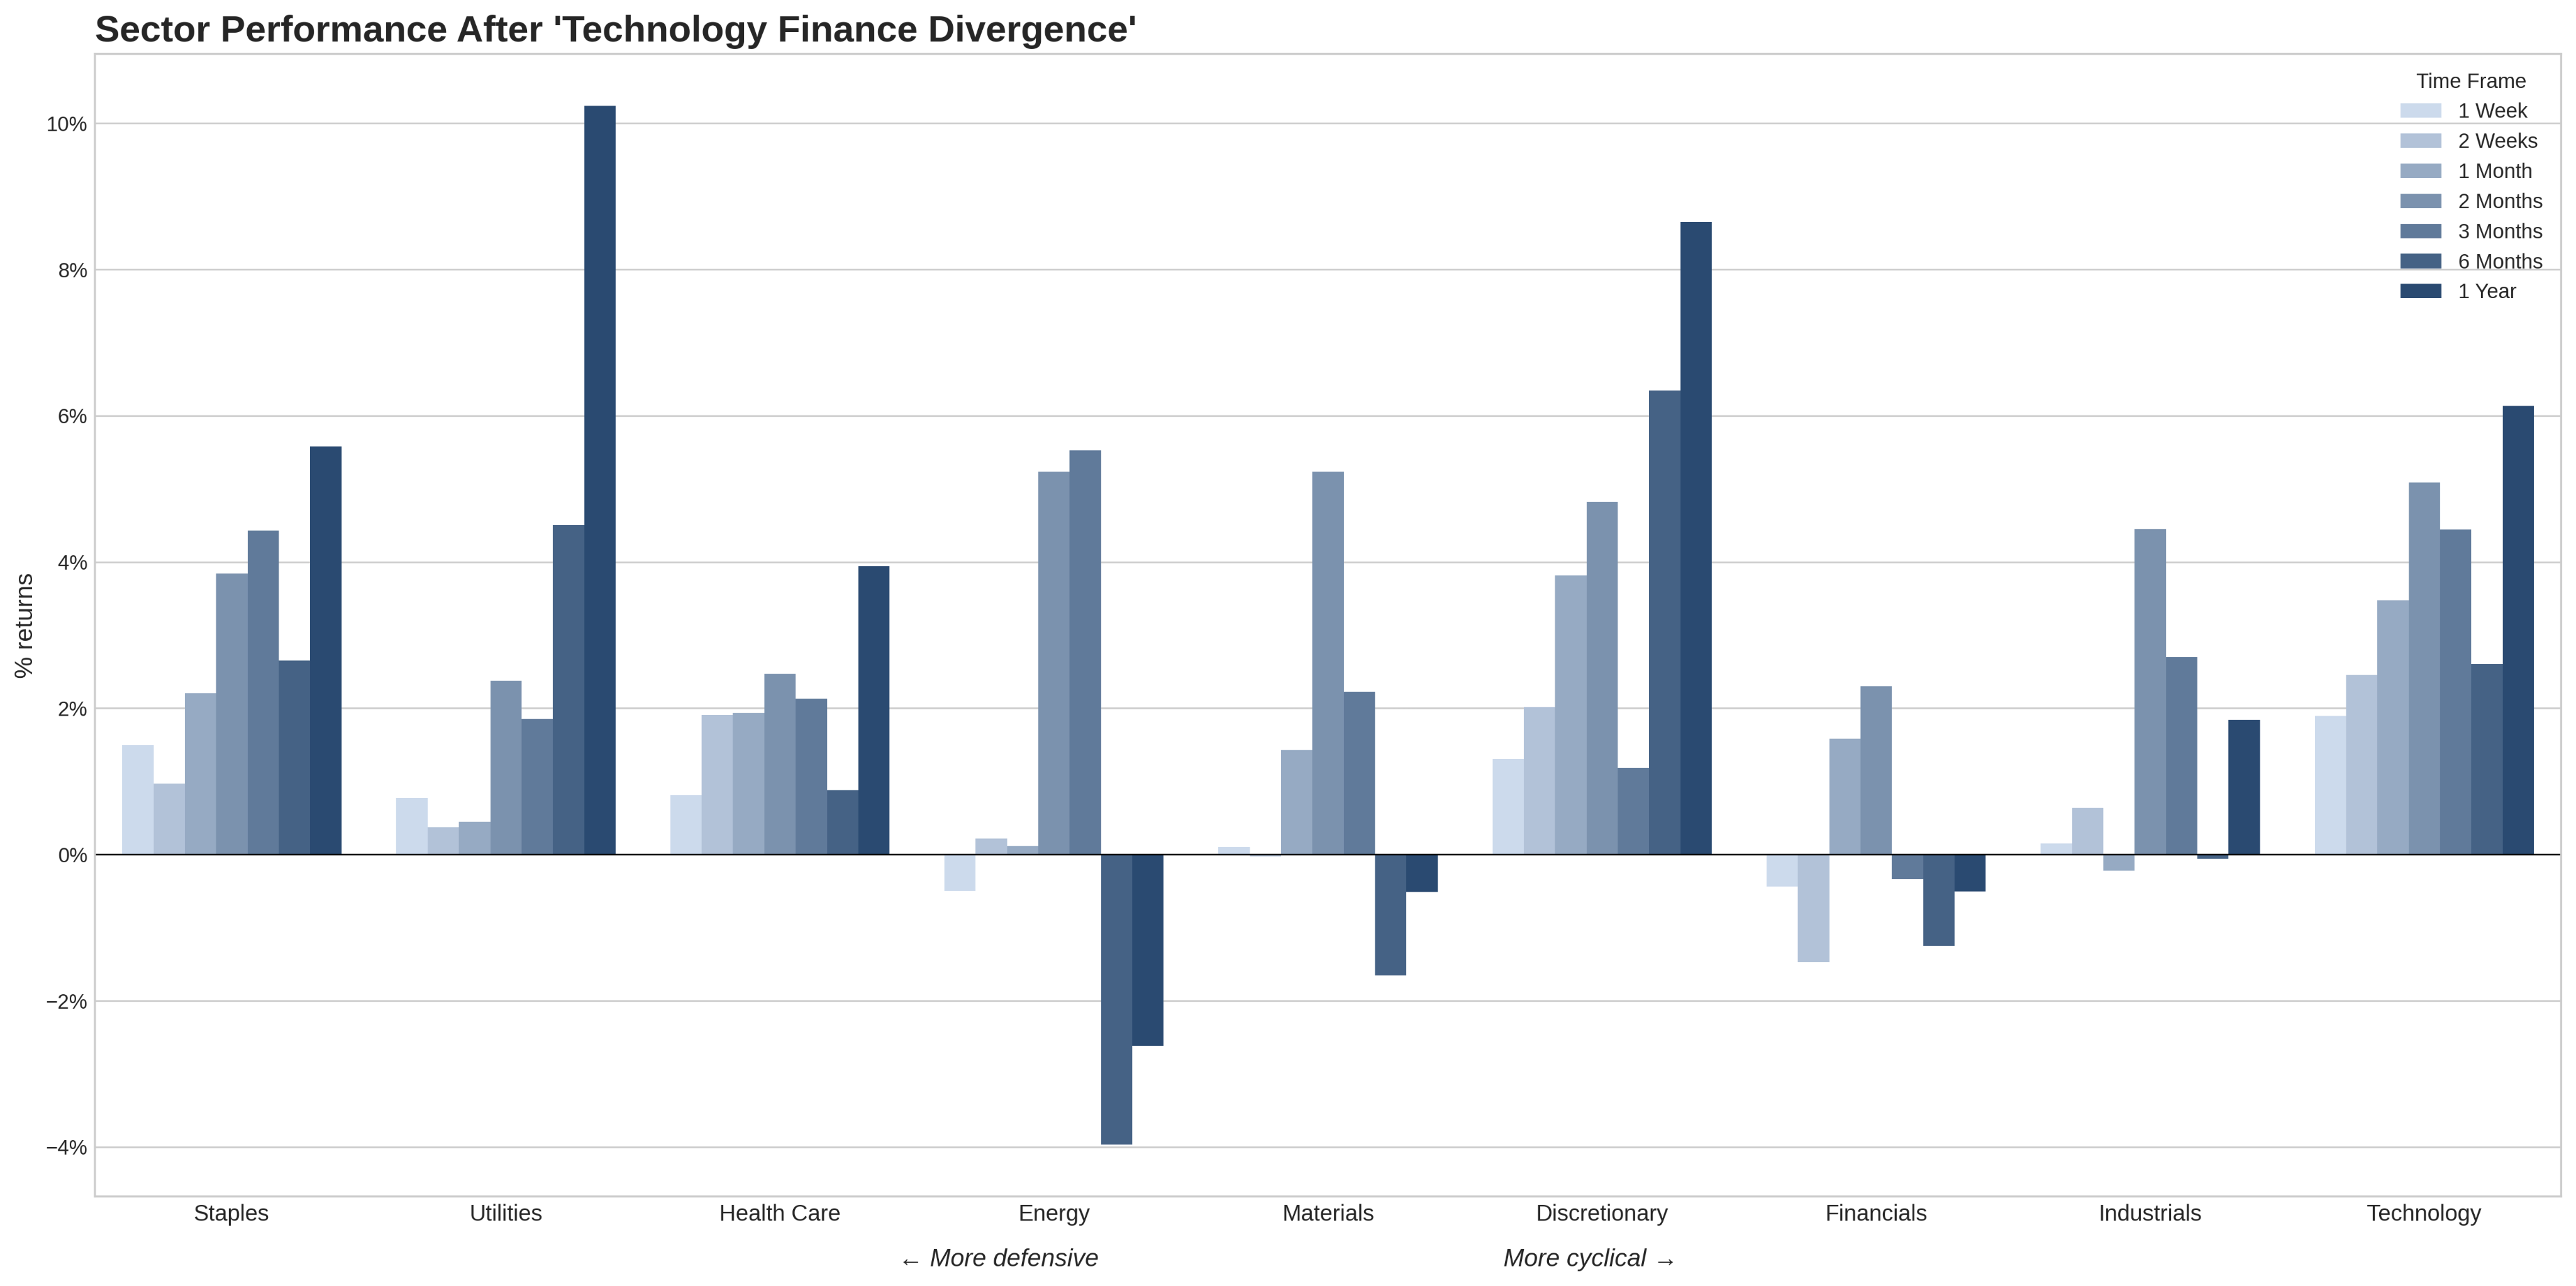
Shifting focus again to other sectors, data reveals that during such periods of volatility and uncertainty, capital tends to flow to more defensive sectors for hedging.
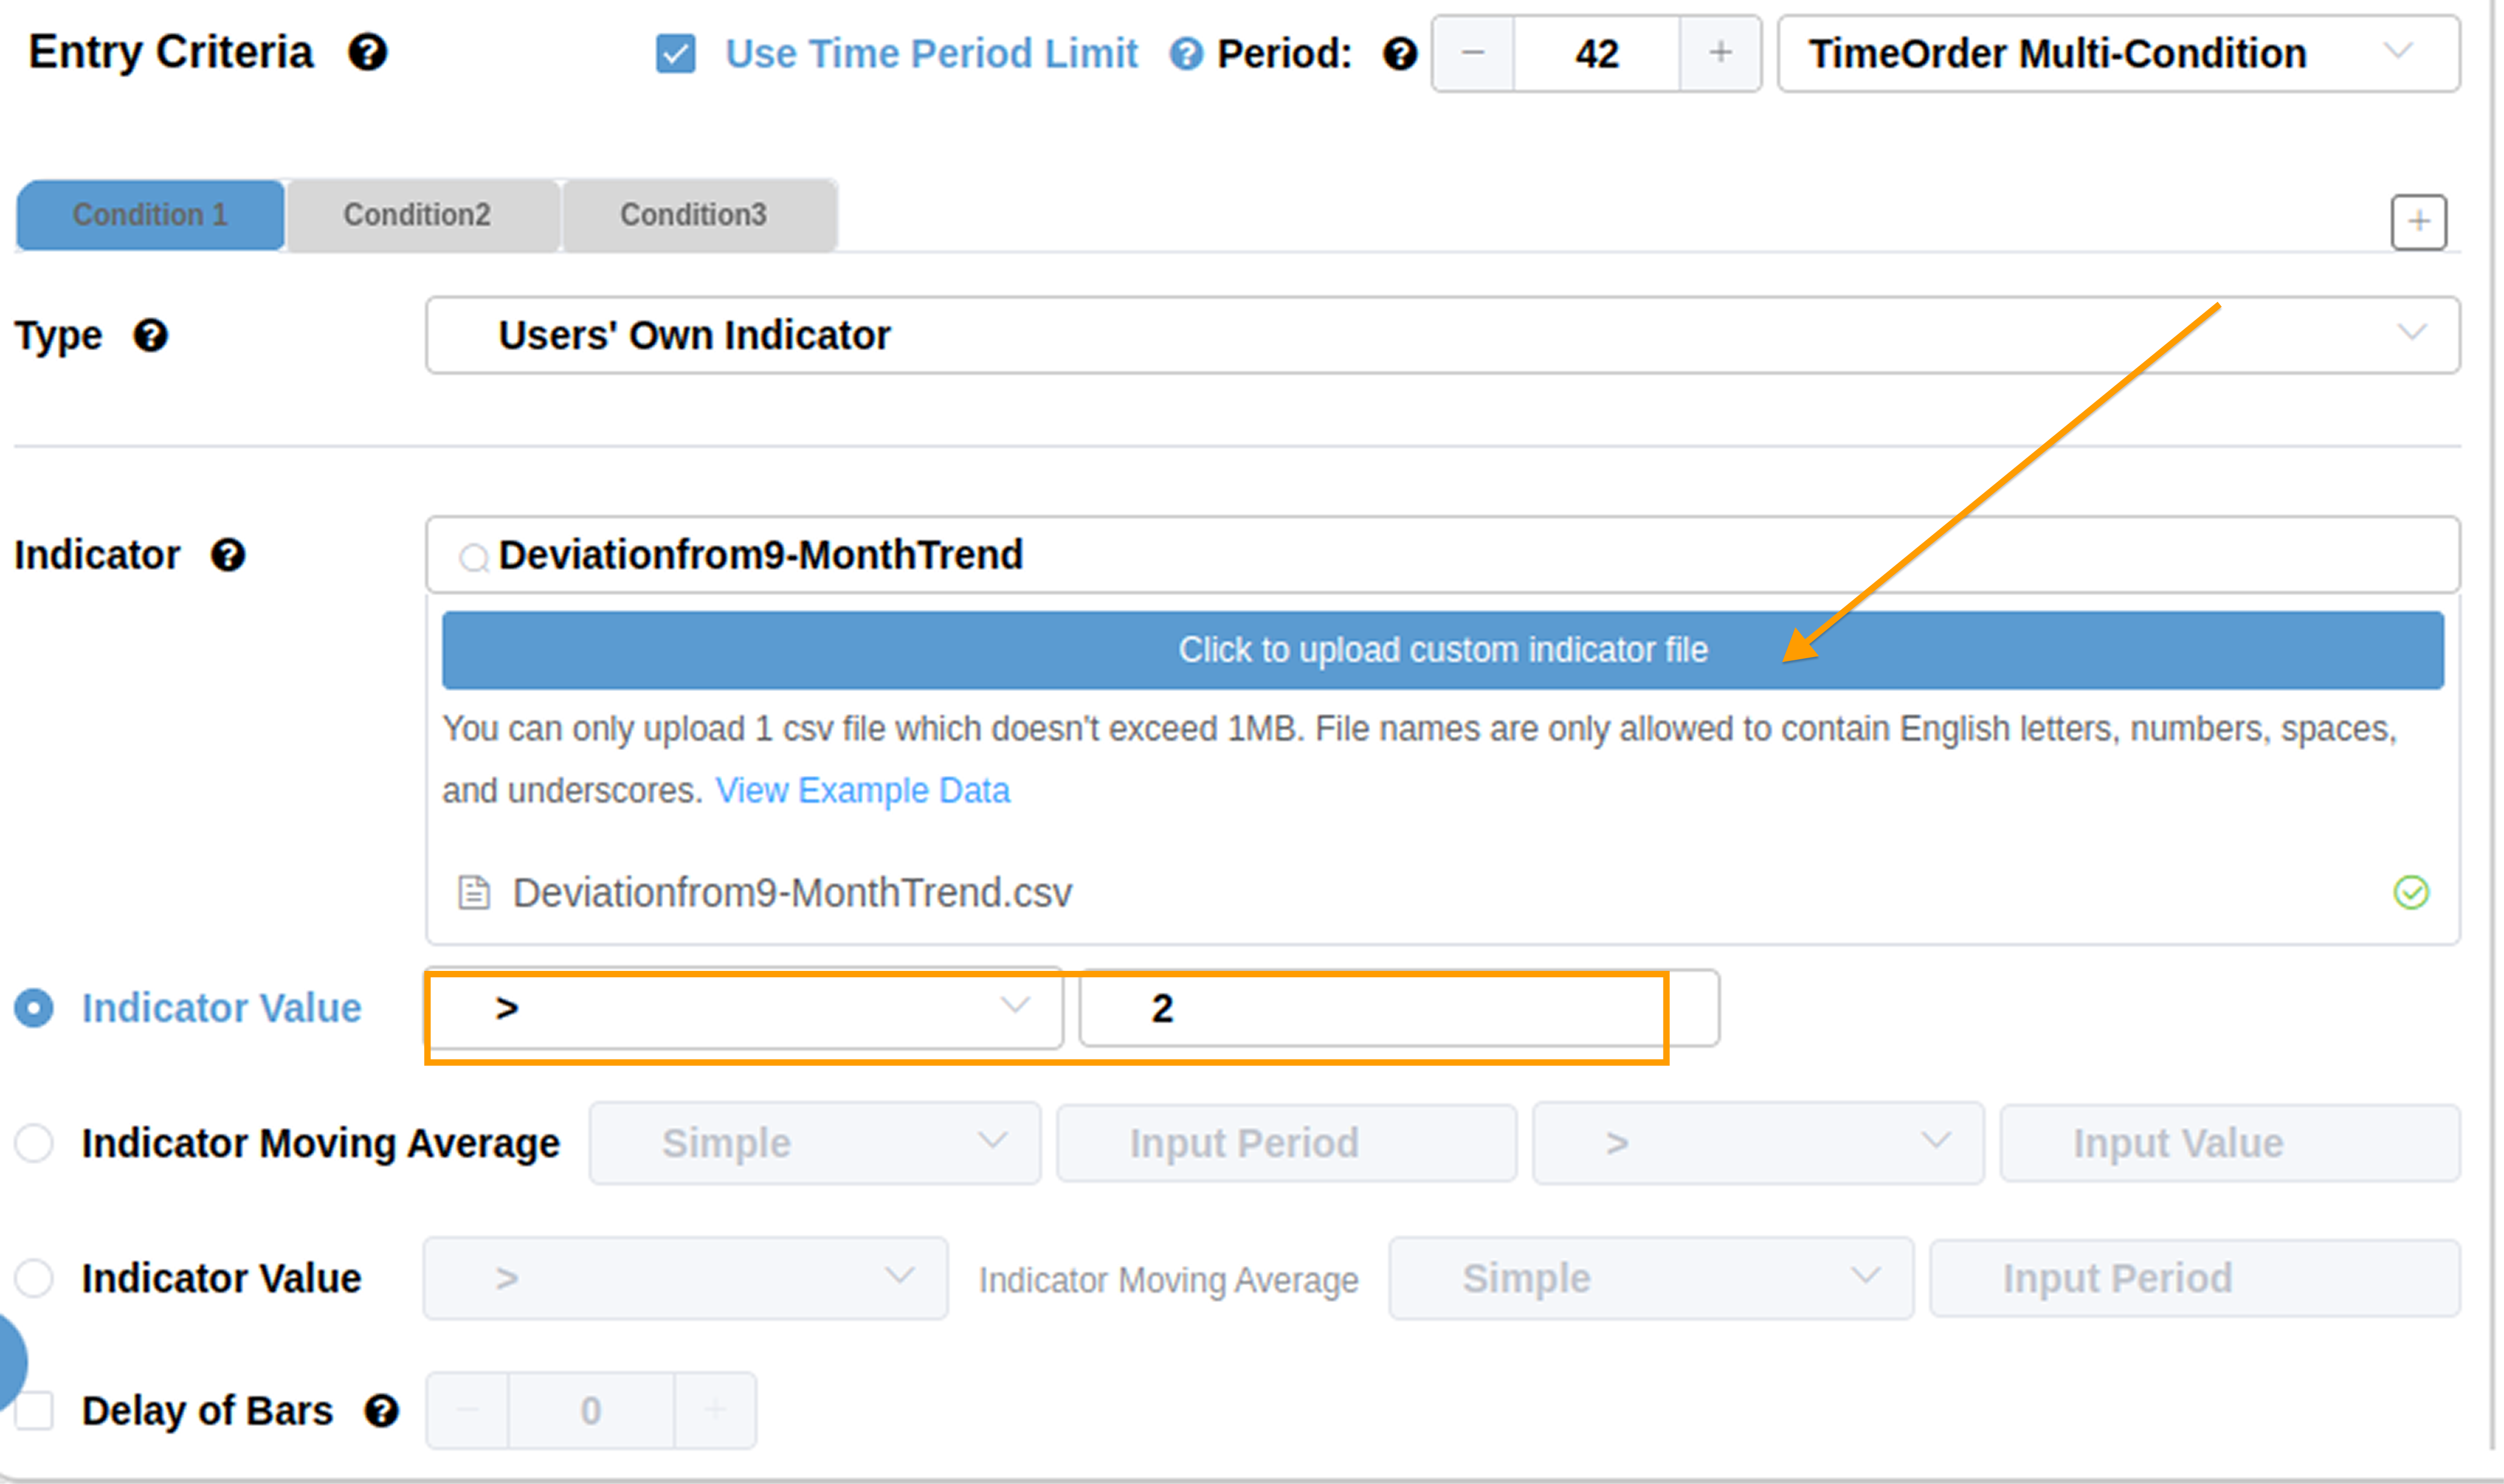
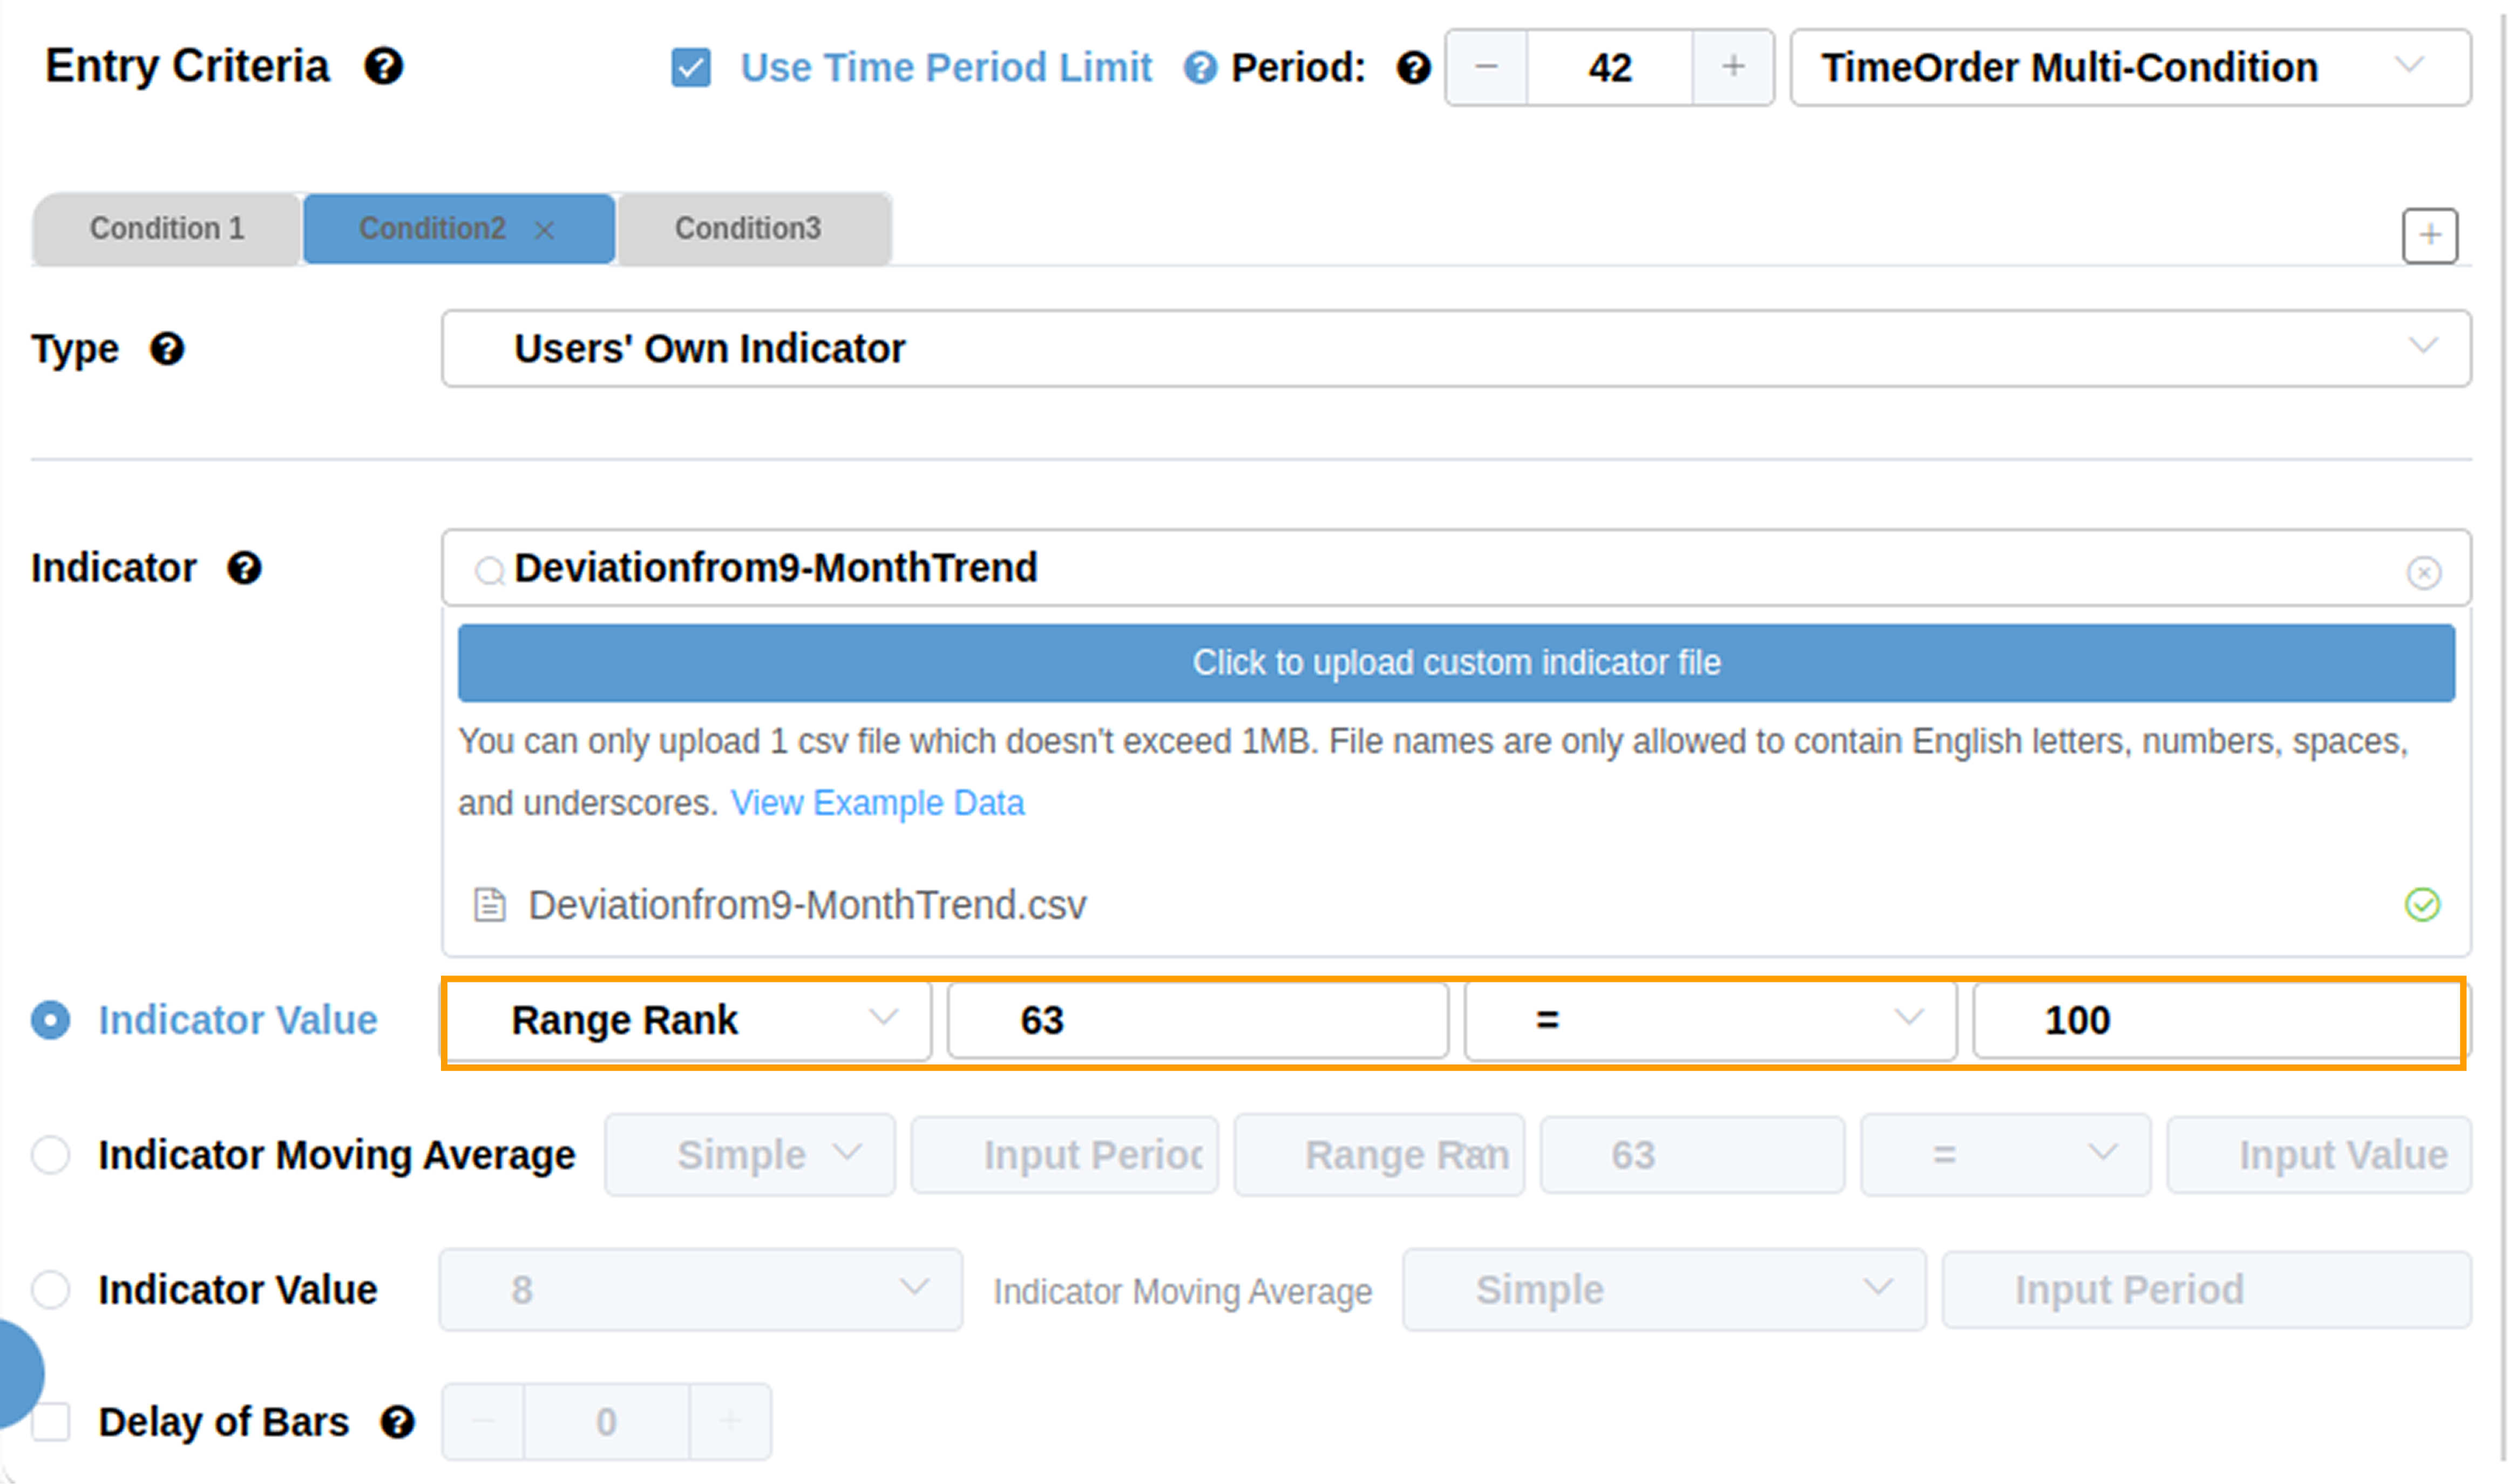
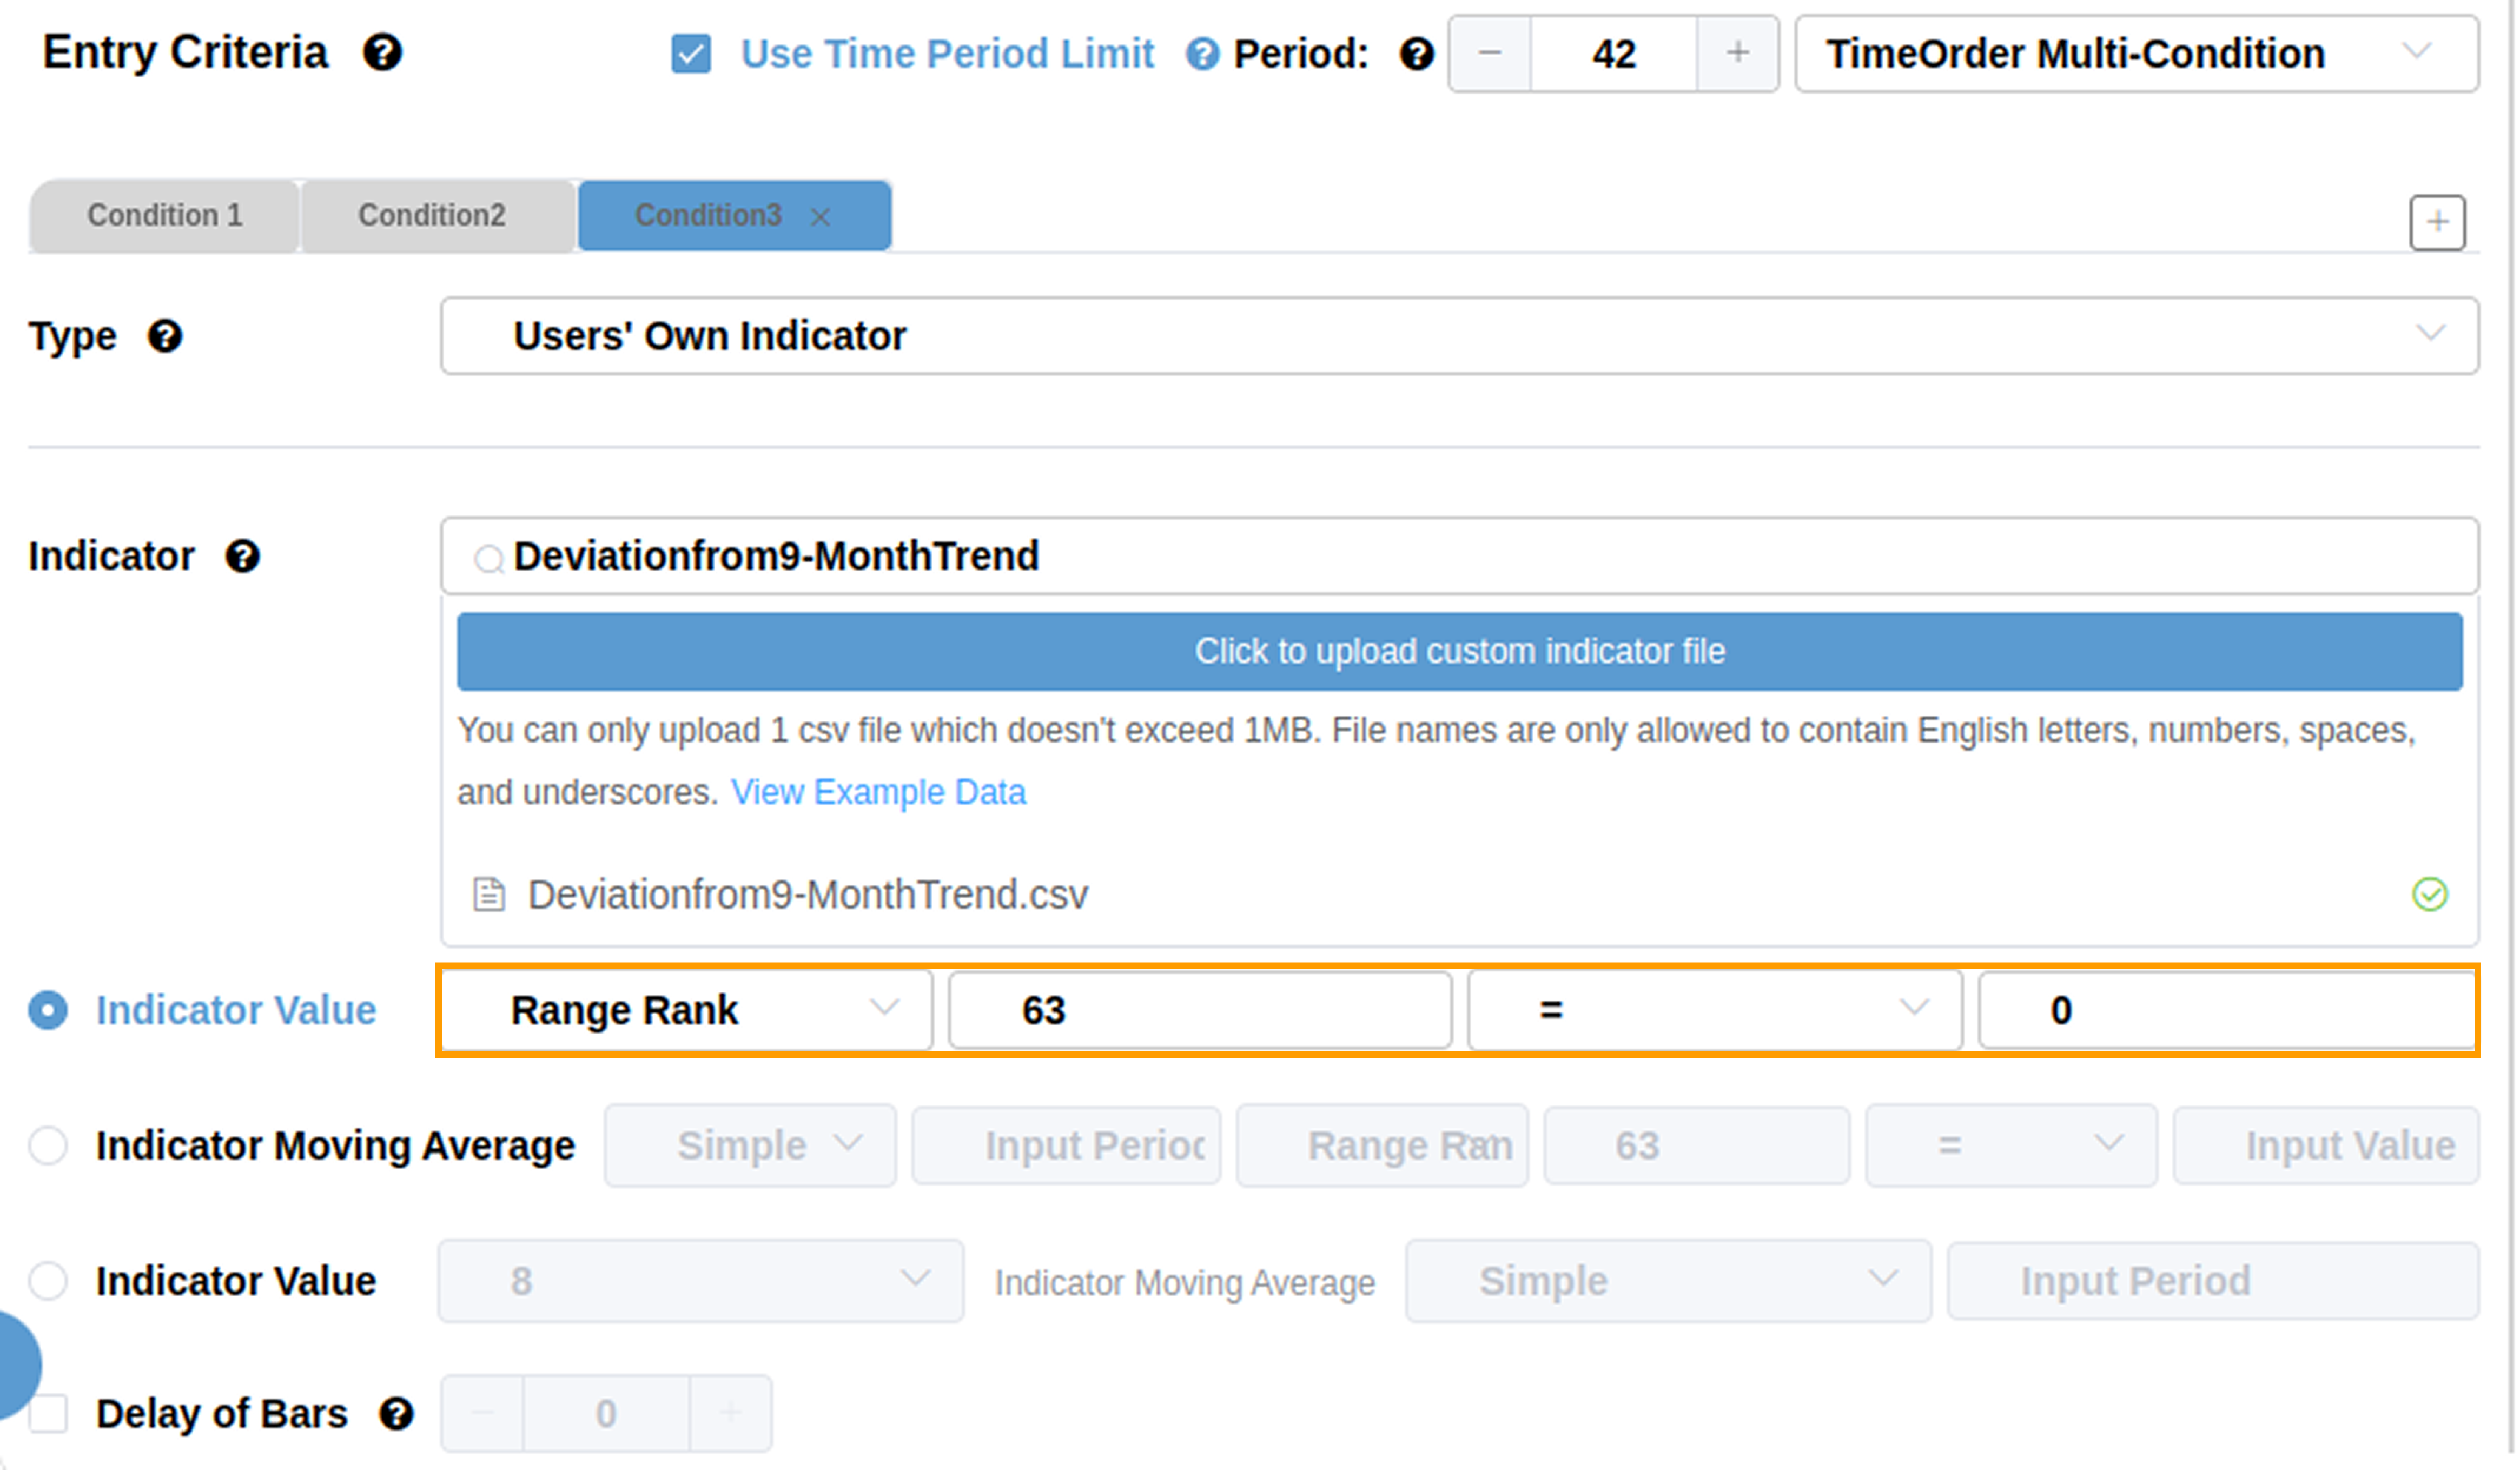
Considering that some new users may not yet be familiar with using our website's backtesting engine, we have outlined the following steps for creating a backtest. In addition to the platform's built-in indicators, you can also upload custom indicators here. Column names in the uploaded CSV file must follow the format [‘Date', ‘Close'], and date format should be like '2000-01-01'. After uploading, you can set specific conditions below, such as interval ranking and drawdown values. For example, in this backtest, we implemented a time-sorting function using these three conditions.
What the Research Tells Us...
In summary, for investors in the current market environment, maintaining rationality amid the rebound in financial stocks may be necessary. Blindly chasing sectors that have already completed a round of valuation recovery could expose investors to the risk of diminishing marginal returns. Before the market direction becomes clear, moderately allocating to defensive assets such as utilities may be a better solution to smooth out volatility.
It is particularly important to emphasize that the above analysis is entirely based on backtest statistics of historical data. While "there is nothing new under the sun" in financial markets, each macroeconomic backdrop is unique. The normalization of the high-interest rate environment and the geopolitical landscape faced in 2025 may cause the current market performance to deviate from historical patterns, and investors still need to make prudent judgments combined with fundamental analysis.