
Is the stock market's rally dead?
If you don't work in the finance/investment industry, I'm going to let you in on a little secret. A secret that all financial marketers know, but the un-initiated do not know. At any given point in time, there are valid reasons to be both bullish AND bearish. The trick to being a good financial marketer/newsletter writer (getting sales, popularity, fame, retweets) is:
- Pick 1 side of the market. Do not flip flop.
- ONLY present the arguments that support your bullish/bearish stance. Hide any evidence that doesn't support your argument.
- Hype things up. If something is a little bearish, show your readers how the factor is crazy crazy crazy bearish. If something is a little bullish, show your readers how the factor is crazy crazy crazy bullish.
- Let everyone know you're here to just "pay it forward and help others out".
- If your market outlook has been wrong for a while, don't worry. Since the market never only goes in 1 direction, "eventually" you'll be right! When you're right, tell every what a genius you are. Cover up the fact that you've been wrong for a long time before being right.
This is something I see A LOT in the trading space. Unfortunately, this is the most effective way to get popular and increase sales for trading services.
Now to be clear, we DO NOT advocate this at SentimenTrader. It's dishonest, and quite frankly doesn't help investors/traders. So throughout the rest of this post, I'm going to show you BOTH the bearish factors and not-so-bearish factors right now. I'll try to avoid hype as much as I can, and focus more on the numbers. Now granted, it is impossible for a person to be 100% unbiased. We're only human. But I'll try to be as unbiased as I can.
Right now, the 2 most important factors for the U.S. stock market are momentum vs. sentiment.
- Momentum is a mixed bag right now. Depending on how you look at it, could be bearish or not-so-bearish
- Sentiment is bearish for equities.
Mixed bag
Tech's extreme momentum
The stock market's momentum is extreme. Extreme momentum doesn't last indefinitely, but it's hard to know when the market will peak. It's easy to spin a story about "the market's rally is dead". Perhaps it is. But then again, people have been calling for a correction for months. Market timing is all that matters, and when it comes to momentum, when is hard to answer.
Among the most egregious examples of momentum lies in tech. The NASDAQ Composite:S&P 500 ratio's 14 week RSI is extremely high. Must be crazy bearish, right?
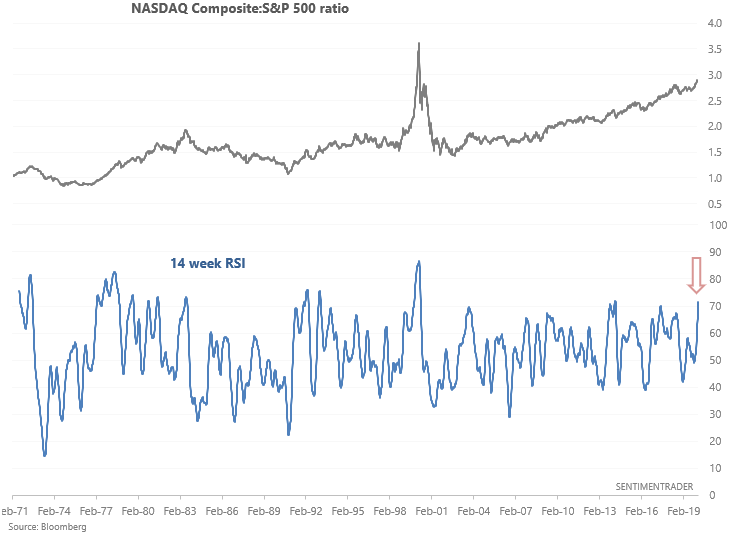
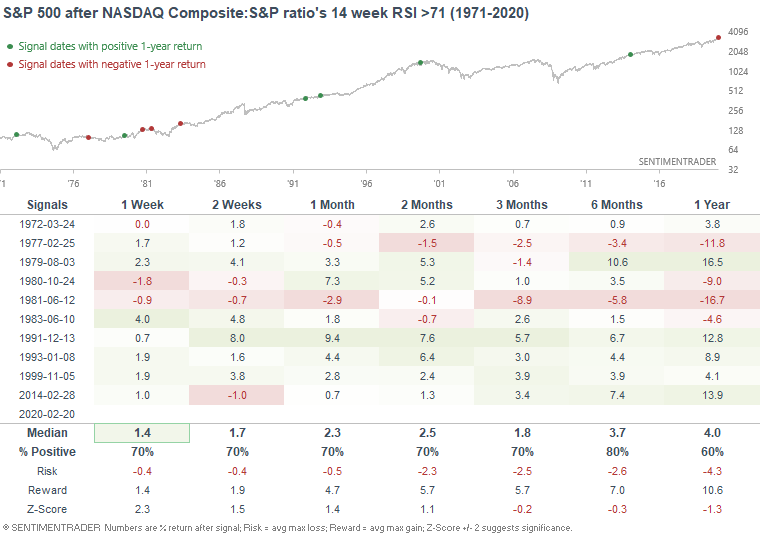
Not quite. Here's what the S&P 500 did next.
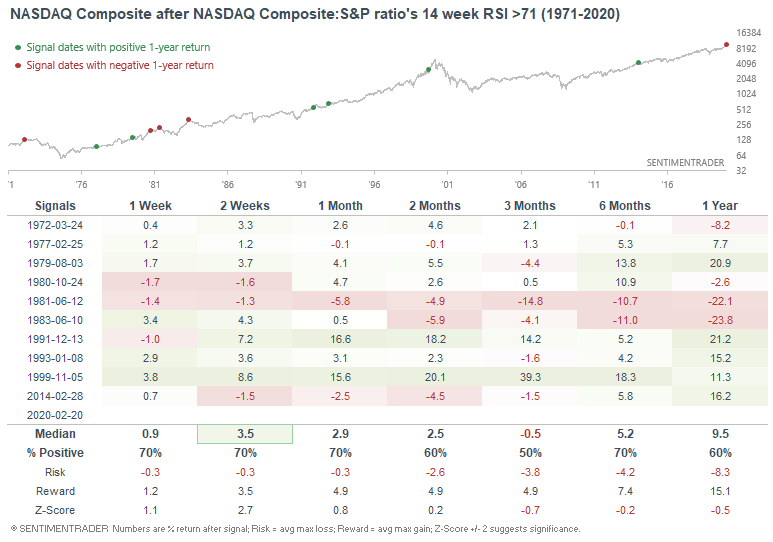
Here's what the NASDAQ Composite did next:
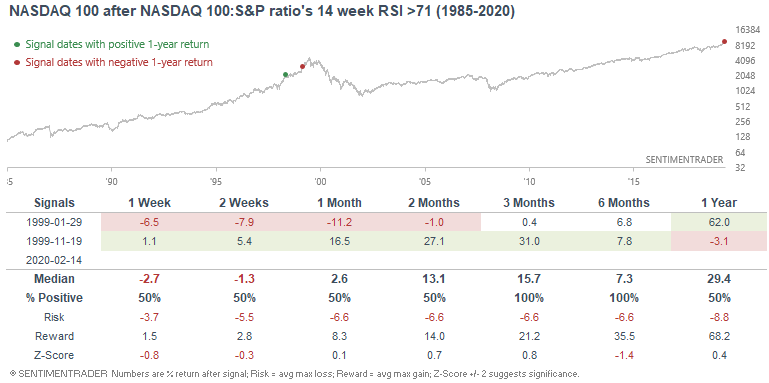
What if we looked at this a bit differently? Use the NASDAQ 100:S&P 500 ratio and its historically high 14 week RSI instead?
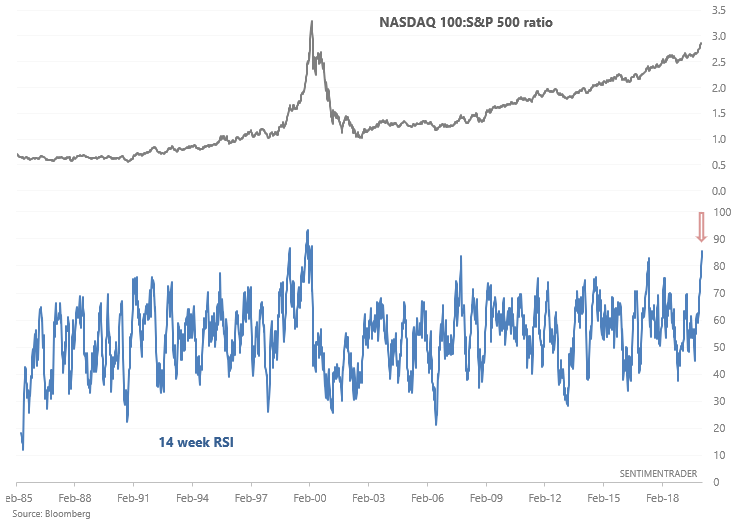
Now we have a sample size of 2. With a sample size of 2, you can draw any conclusion you want.
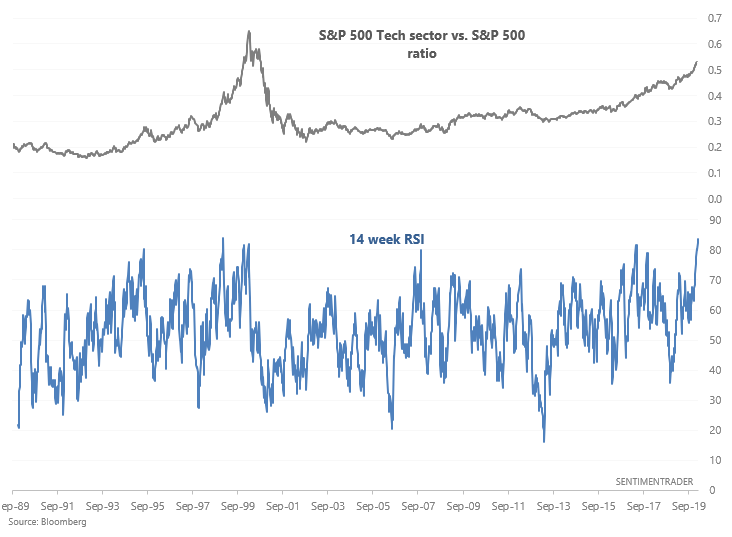
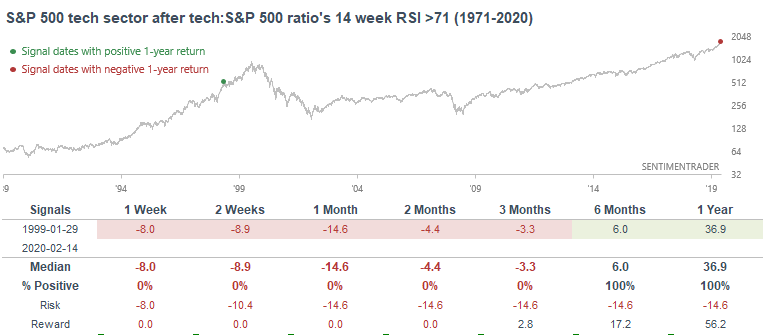
Now what if we looked at the S&P 500 tech vs. S&P 500 ratio and its 14 week RSI?
The sample size shrinks to 1. Certainly fits the "stocks are overextended, need to pullback" narrative. But I don't like sample sizes of 1.
So what if we looked at this from a different angle? The number of weeks the S&P 500 tech sector has gone up over the past 20 weeks?
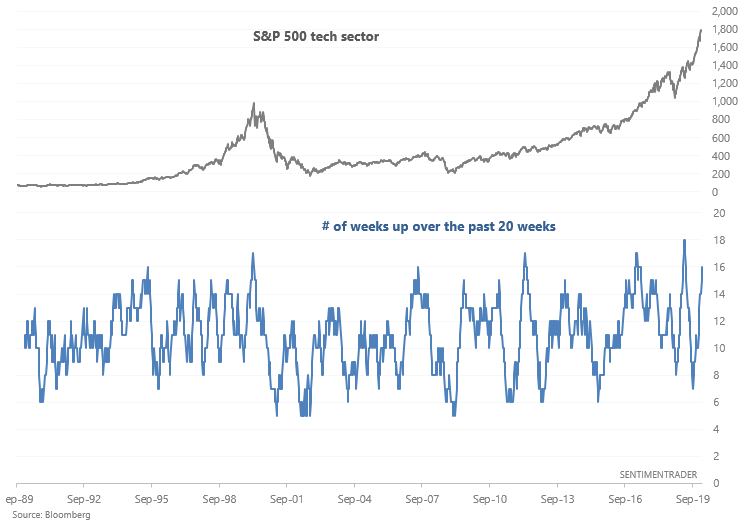 This time, the S&P 500 tech sector's returns over the next month are indeed somewhat bearish:
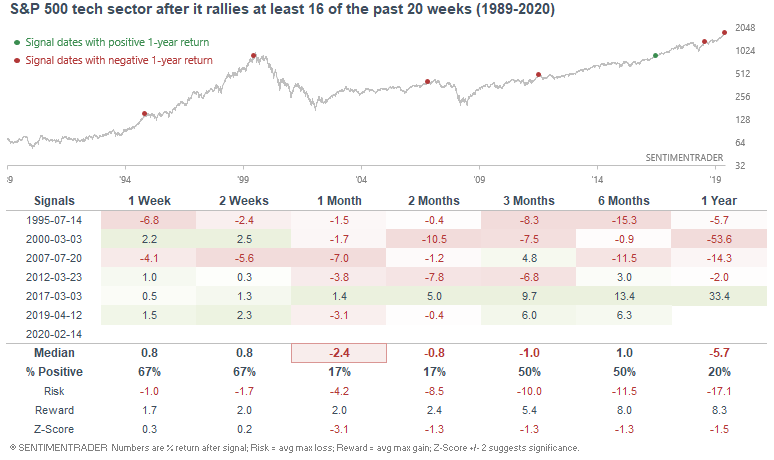
Here were the max drawdowns:
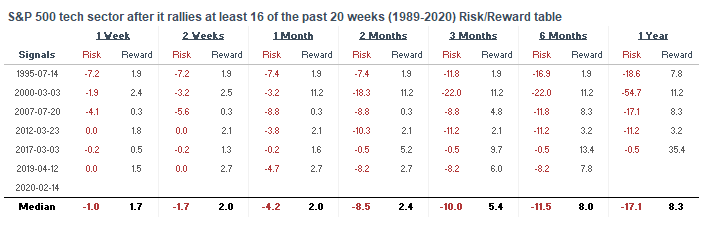
Bottomline: momentum is extreme. Somewhat bearish for stocks? Yes. Crazy bearish? Depends on how you spin the story. Personally, I avoid hype. But here's an example of hype (i.e. picking out the 1 piece of crazy bearish "evidence" and ignoring the less extreme evidence):
"Tech's momentum is extreme. NASDAQ 100's 20 day moving average has gone up 88 days in a row, THE MOST EXTREME IN HISTORY. Similar streaks ended with SHARP corrections over the next month."
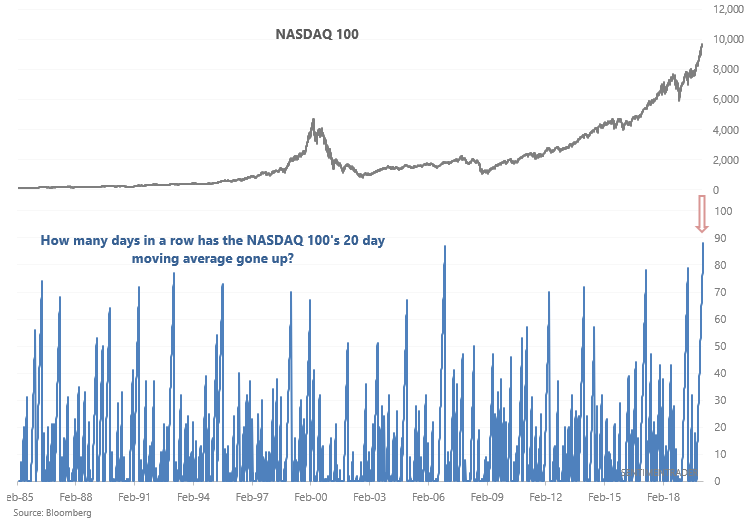
If we want to avoid hype, we can look at the data:
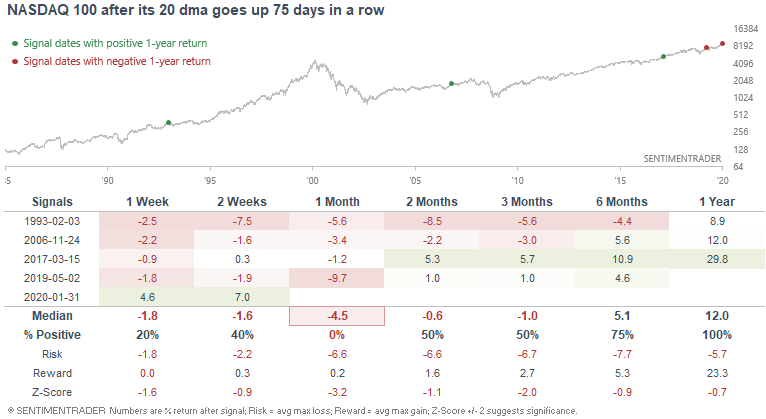
Here are the max drawdowns:
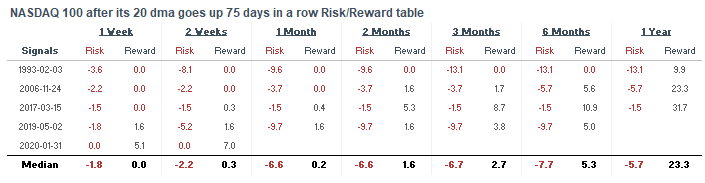
Bearish? Yes. But we're dealing with a sample size of 4 here.
The bad
Sentiment
Sentiment has been extremely optimistic for a long time. This remains a bearish factor for U.S. equities, although it thusfar the stock market has refused to make a decent pullback/correction.
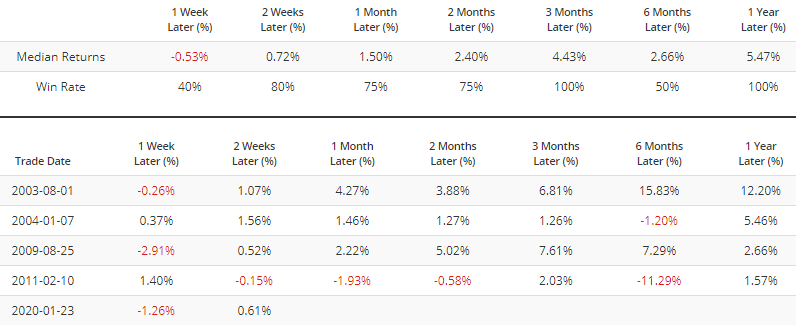
For example, the Intermediate Term Optimism Index's 100 dma is extremely high.
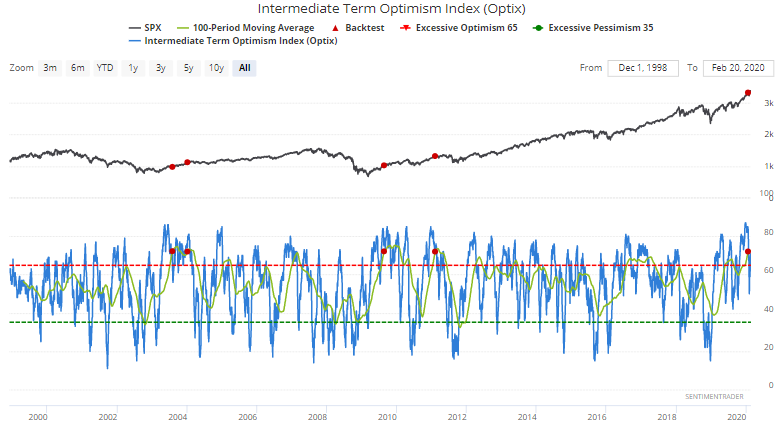
The few other times this happened, the S&P 500's returns over the next 6 months were below average. A little bearish, but not crazy crazy crazy bearish.
Meanwhile, most advisor and investor surveys are quite bullish towards stocks. AIM's 20 week average is quite high right now:
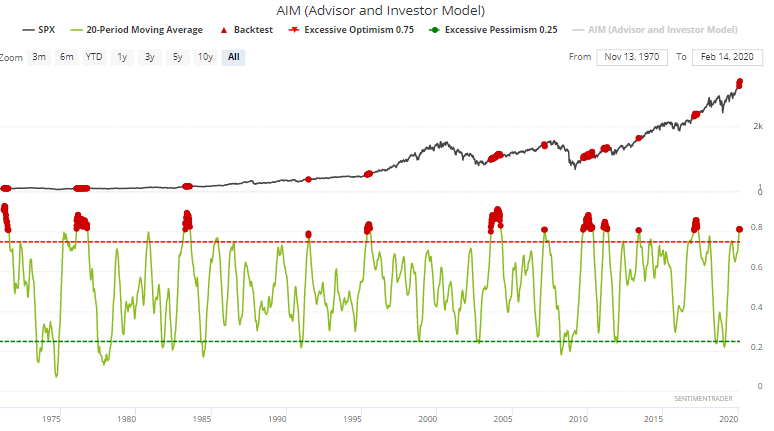
Once again, this led to below-average returns over the next 6 months, but this wasn't crazy crazy crazy bearish.
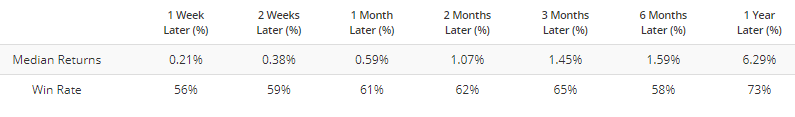
Traders continue to be extremely bullish, causing various Put/Call ratios to remain consistently low. For example, here's the de-trended Equity Put/Call Ratio's 100 dma:
Insane optimism, isn't it?
When this happened in the past, the S&P's returns over the next 2 months were below random. "Eventually" there was a correction somewhere. But this isn't insanely bearish.
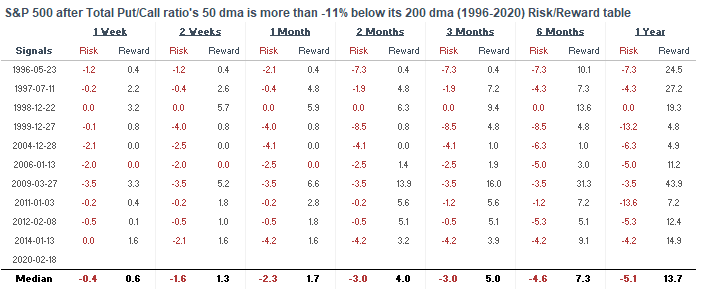
As for the Total Put/Call ratio, its 50 dma remains extremely far below its 200 dma:
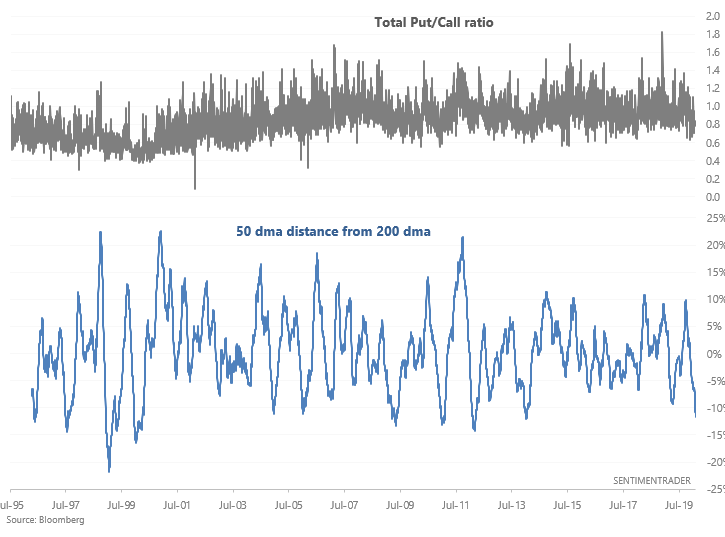
When things were this extreme in the past, the S&P 500's returns over the next week leaned bearish, but this wasn't insanely bearish.
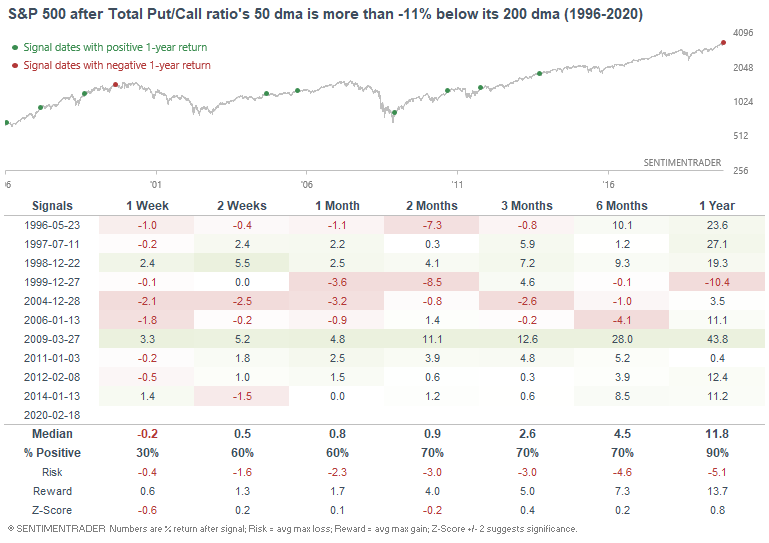
Here were the S&P 500's drawdowns:
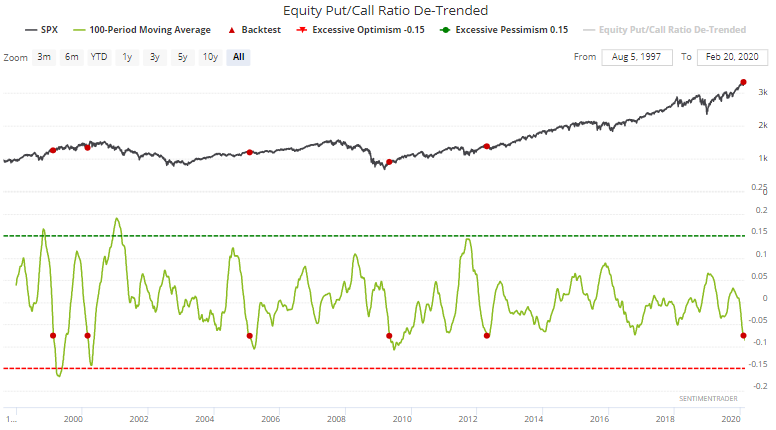
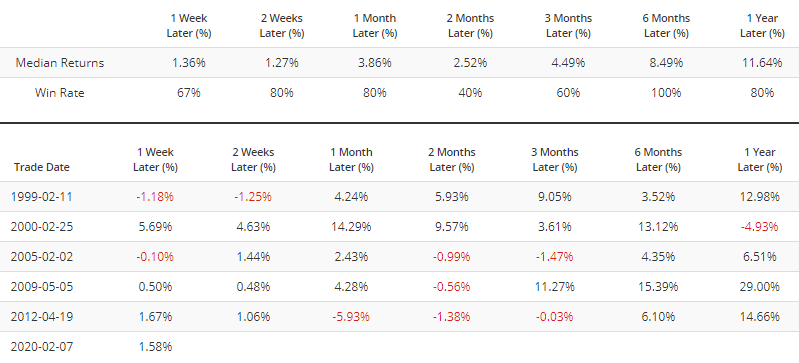
And lastly, a 100 day average of the % of indicators showing excess optimism - excess pessimism is extremely high:
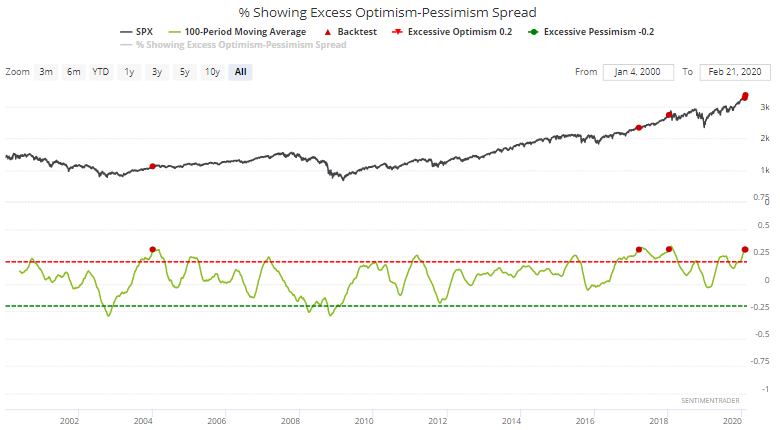
This has only been matched 3 other times over the past 20 years:
- January 2004: market eventually made a correction that lasted many months
- March 2017: no correction at all.
- January 2018: market eventually tanked
Somewhat bearish? Yes. "Insanely bearish"? No.
Conclusion
Beware of financial marketers whose job is to hype things up in order to sell a narrative. Is the market's rally "definitely dead?" Perhaps. But then again, people have been saying this for weeks if not months. If you look at the data, the more reasonable narrative is:
- The market is overextended based on sentiment and momentum, hence the probability of a pullback/correction is higher than normal.
- Probability is not certainty. Nobody consistently and accurately knows "when". All we can know is risk:reward.