
Is the recent rally in t-bonds for real?

Key points
- After an epic multi-year decline, long-term treasury bonds are threatening to establish a new uptrend
- But long-term rates are still in an uptrend...
- ...and seasonality is unfavorable, and trader sentiment recently reached a frothy level
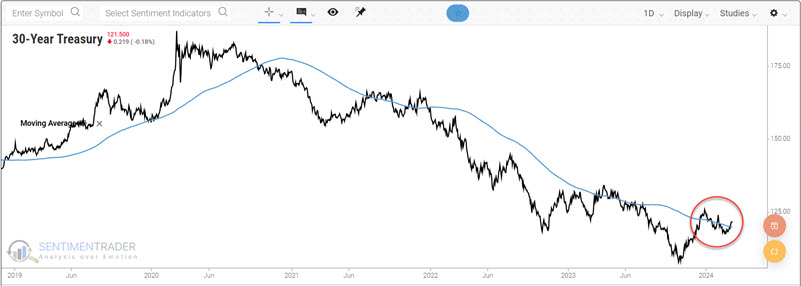
Long-term treasuries attempting to establish a bullish trend
From the March 2020 high to the October 2023 low, long-term treasury bond futures prices suffered a staggering -42%+ decline from peak-to-valley. Because long-term treasuries are a pure play on interest rate changes, this bear market directly resulted from long-term interest rates rising from a low of 0.84% to 5.15%. Since then, rates have dropped to roughly 4.25%, and bond prices have bounced back somewhat.
As you can see in the chart below, one can argue that t-bonds are now in an uptrend, as the price is back above the 200-day moving average.
Even if the recent advance proves merely to be a "rally in a bear market," simple math tells us that a 40% to 60% retracement of the 2020-2024 bear market in treasury bonds still leaves t-bonds with 15% to 28% of upside potential. Still, before breaking out the champagne and shouting, "Happy Days are here again," traders should make a note of several things.
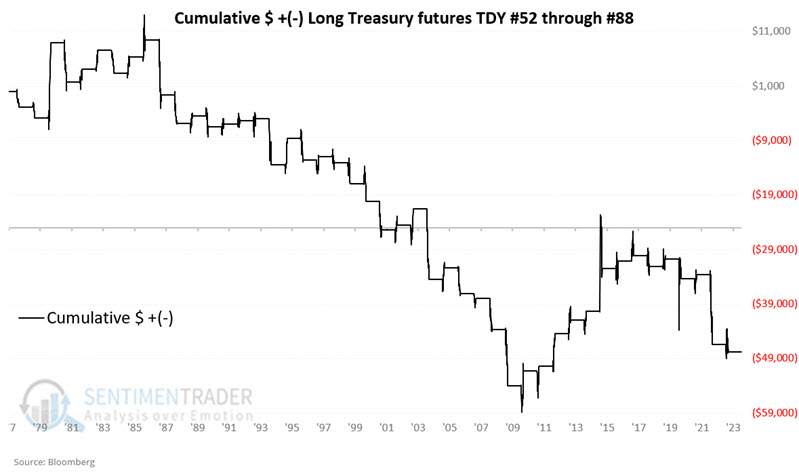
One important clue to watch for is whether t-bonds can move decisively above their 200-day average and if that 200-day average begins to turn higher. Price has popped above the 200-day moving average several times in the last few years. However, those forays were typically short-lived. At present, the 200-day average itself remains in a downtrend. Historically, this has not been a favorable configuration for bonds.
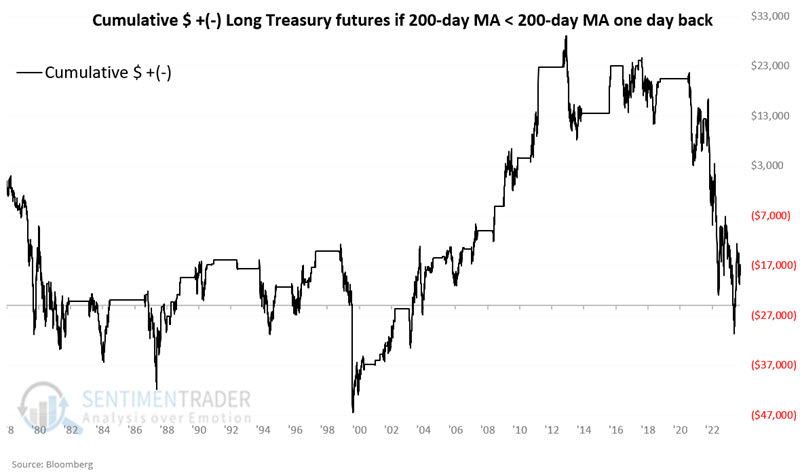
The chart below displays the cumulative $ +(-) for t-bond futures when the 200-day moving average for t-bond futures was in a downtrend.
While the bounce has been a welcome respite for bond investors and could carry further, there are several reasons to avoid betting heavily on long-term bonds for now.
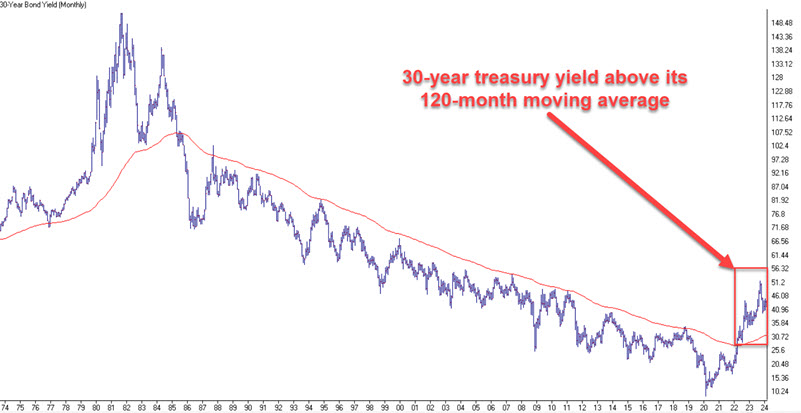
The long-term trend in interest rates is higher
Interest rates tend to move in exceedingly long waves (30+ years of rising rates followed by 30+ years of declining rates). In the chart below (courtesy of AIQ TradingExpert), the yield on long-term treasury bonds (x 10) is still above its 120-month moving average. While no "prediction" is built into this, it presently identifies the long-term trend in interest rates as "up." That is not bullish for 30-year treasury bonds.
Seasonality is still a headwind
The chart below displays the annual seasonal trend for t-bond futures. Note that we are nearing an unfavorable period that extends from the close on Trading Day of the Year (TDY) #52 through the close on TDY #88. For 2024, this period extends from the close on 2024-03-13 through 2024-05-03. Likewise, t-bonds tend to show weakness in March and April.
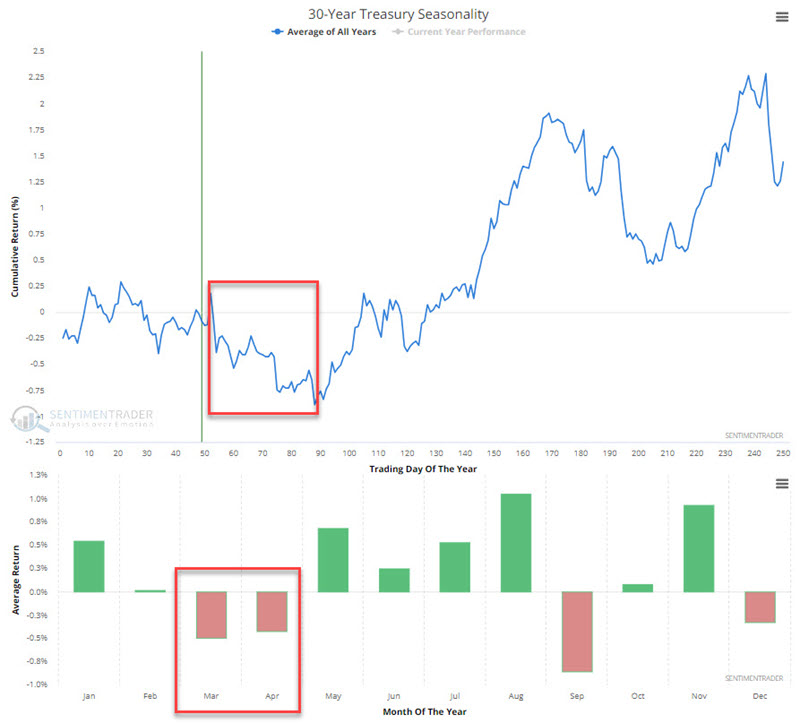
The chart below displays the cumulative hypothetical $ +(-) achieved by holding a long position in 30-year futures only during the TDY 52 through TDY #88 period each year starting in 1978.
The table below summarizes the results.
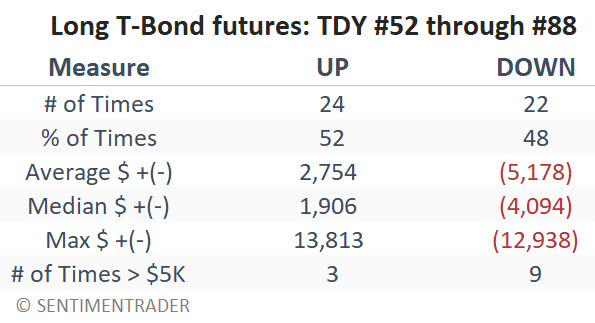
While overall results skew decidedly negative, it is essential to note that this period has a Win Rate above 50% (including eight consecutive "up" periods from 2010 through 2017). This tells us two things:
- A decline during this period is not a sure thing that should compel bond traders to play the short side
- When this period is good, it's OK, but when it's bad, it's very bad
Bond trader optimism spiked quickly
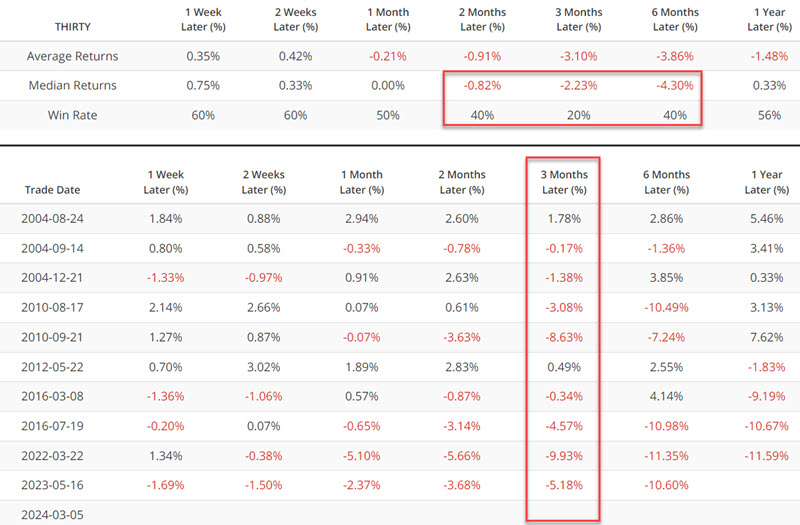
The recent bounce in t-bond prices brought the bond bulls back to life in a big way. As you can see in the chart below, the Optix indicator recently hit 100%. As you can also see in the chart and table below, while intermediate-term results skewed favorably, 12-month returns were quite unfavorable overall.
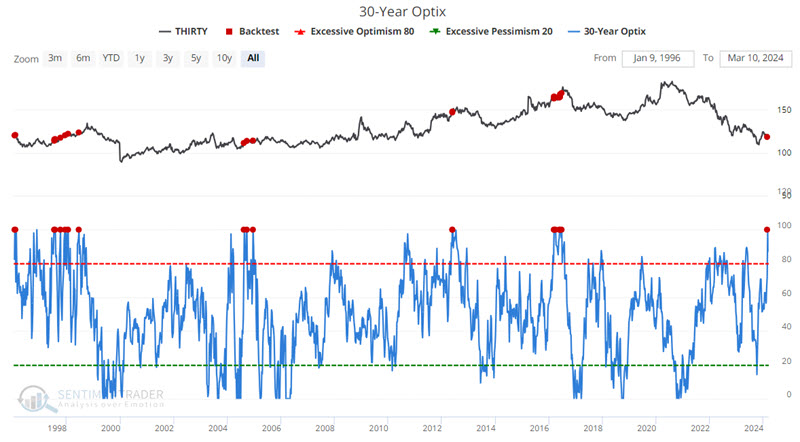
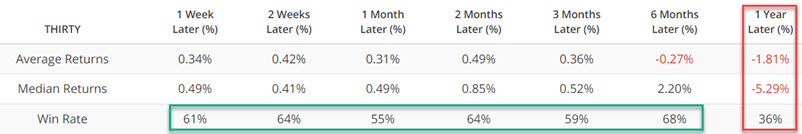
If we look at when the 3-week average of T-Bond Optix crossed above 86% during the last 20 years, we see an even greater propensity for bond weakness, particularly in the 3-month time frame.
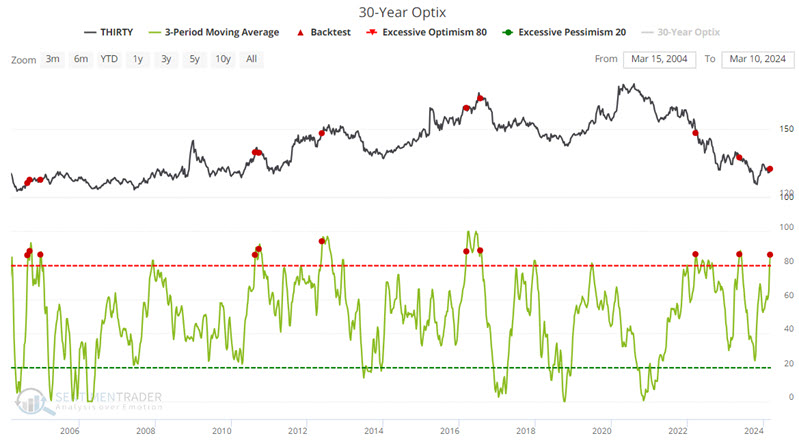
The willingness of traders to turn bullish so quickly following a relatively modest rally appears to be a potential red flag.
What the research tells us…
T-bonds suffered a devastating bear market decline over three and a half years. In reality, even a 40% to 60% retracement of the ground lost during the bear market would leave t-bonds still with a lot of upside potential. That said, the current long-term rising trend in interest rates, an unfavorable seasonal window, and overwhelming bullishness among bond traders suggest that now may not be the best time to press the bullish side.