
Is the Gold Miners rally becoming too crowded?

Key points
- While crude oil struggles, Gold Miners (GDX) have rallied, supported by rising gold prices and falling input costs.
- However, internal breadth metrics have reached extremes that historically signal exhaustion.
- The percentage of miners in a "correction" has dropped to historically low levels, a condition that has often preceded negative returns over the subsequent three months.
- Additionally, a surge in the percentage of miners above their 50-day average suggests the sector may be overheating.
Most miners are out of correction territory
Unlike the broad stock market's consistent heat, the commodities complex presents a mixed, deflationary picture. As noted in last week's report, crude oil has plunged to multi-year lows, a trend that looks set to continue. Gold and Silver, however, are diverging from oil, benefiting from uncertainty in the global monetary system and expectations of lower real rates.
Gold Miners (GDX): The Gold Miners ETF (GDX) performed strongly, surging 2.47% last Friday to close at $87.79.
Data shows that GDX recently recorded a net inflow of approximately $420 million, increasing outstanding shares by 1.7%. This suggests that "smart money" is betting on an earnings breakout for miners-higher gold prices boost revenue, while falling oil prices (a key input) lower extraction costs, potentially leading to significant margin expansion.
However, for years, we have repeatedly seen that momentum in gold mining stocks tends to be extremely fleeting. Outside of rare breakaway moments, rallies are often met with heavy selling pressure.
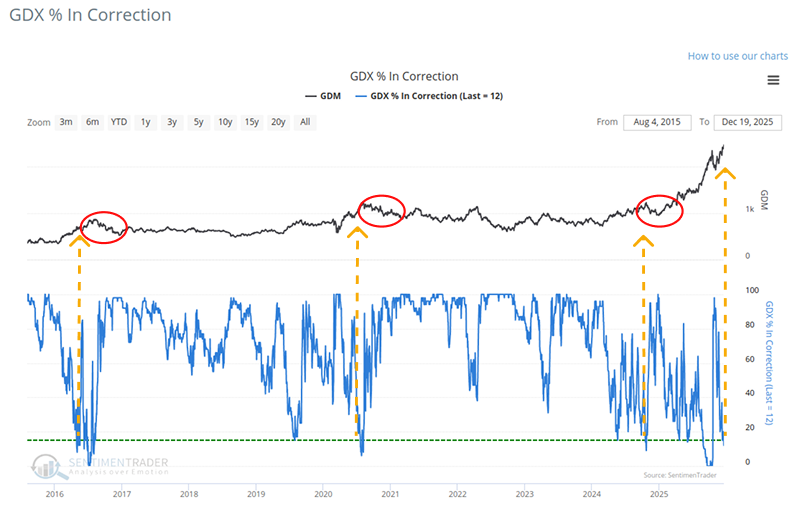
We can see this just by looking at the last few years. Whenever fewer than 15% of mining companies are in a correction-meaning at least 85% of miners are within 10% of their 52-week highs-the GDX fund has often peaked shortly thereafter.
Since the raw count of times fewer than 15% of miners are in a correction is somewhat rare, we applied an 84-day range rank to the data. The GDX % In Correction 84-day range rank has recently reversed lower after hitting the top of its range. For the related backtest, click here.
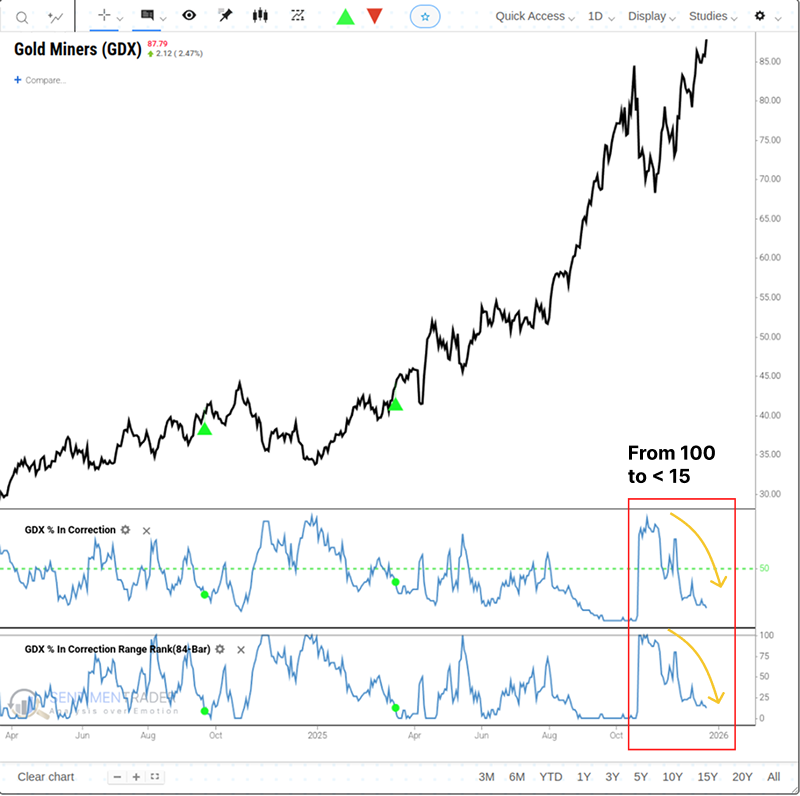
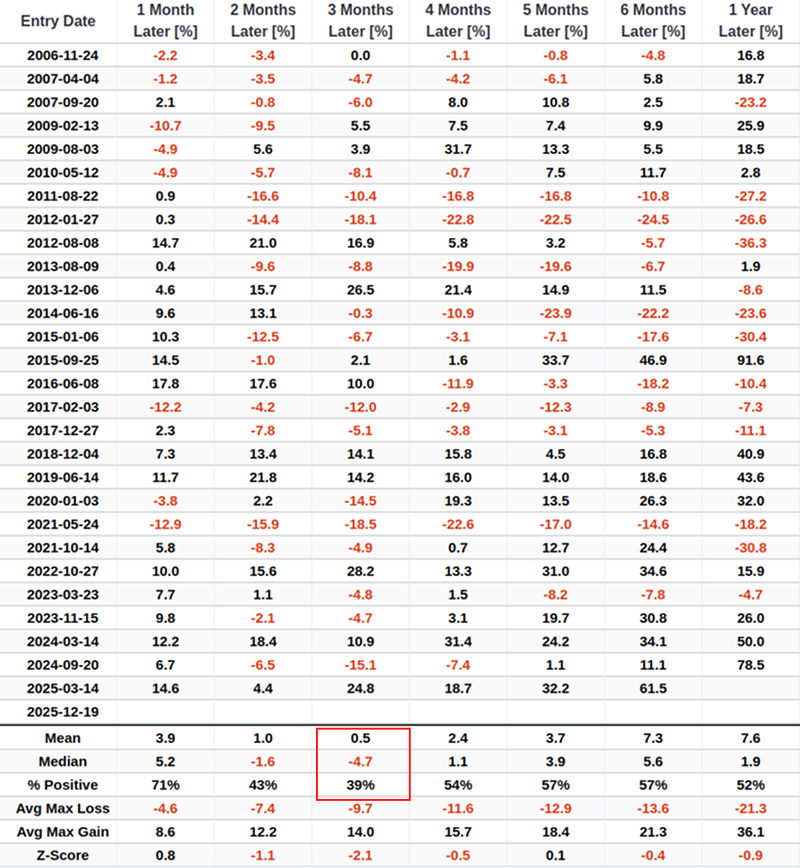
Whenever the GDX % In Correction 84-day range rank cycles from 100% to below 15%, the subsequent three months showed relatively weak historical performance.
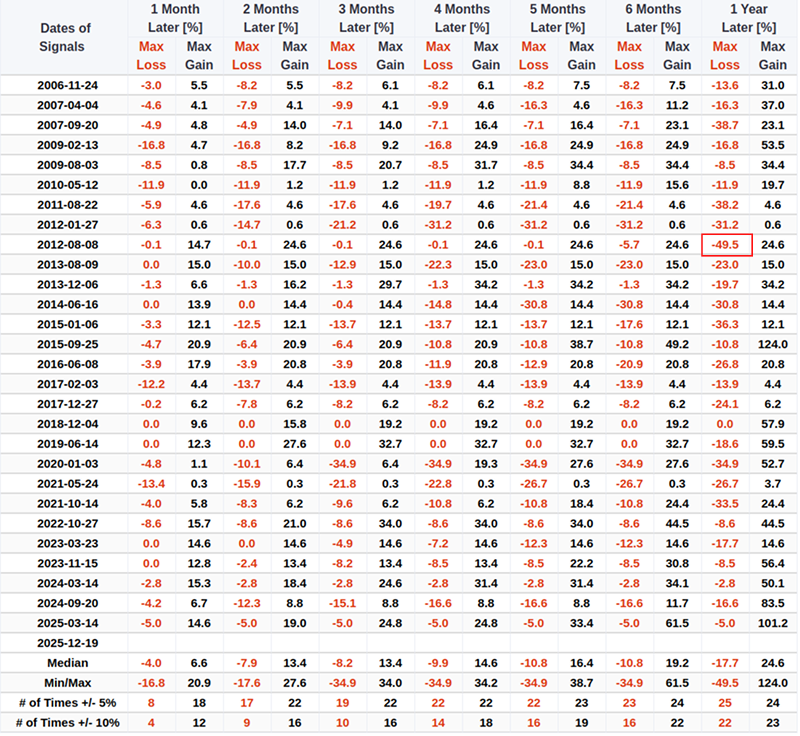
Historically, while there is potential for upside after this signal triggers, it is often accompanied by significant downside risk. In extreme cases, such as in 2012, drawdowns approached 50%.
How can I recreate this signal in the Backtest Engine?
Complete the following tasks in the Entry Criteria section:
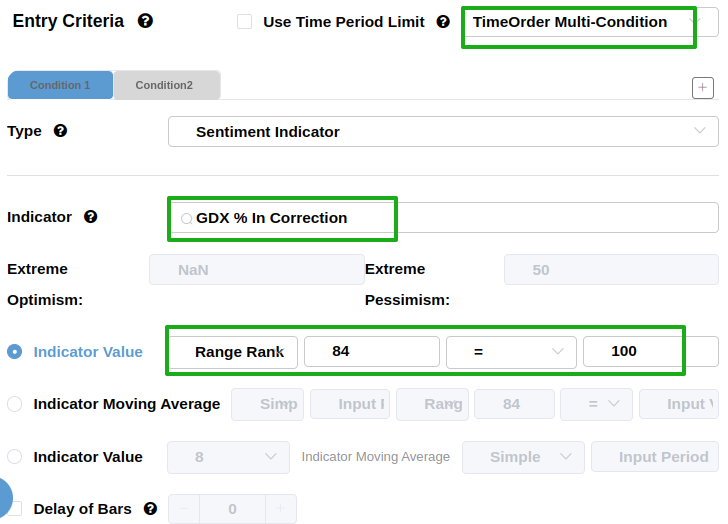
- Select TimeOrder Multi-Condition in the top right-hand corner
- In the Indicator search box, type GDX % In Correction and select the indicator
- In the Indicator Value dropdown, choose Range Rank, change the lookback from 21 to 84, select "=" and enter 100
Click on the Condition2 tab and complete steps 2 and 3 from above. However, this time, select CrossBelow and enter 15.
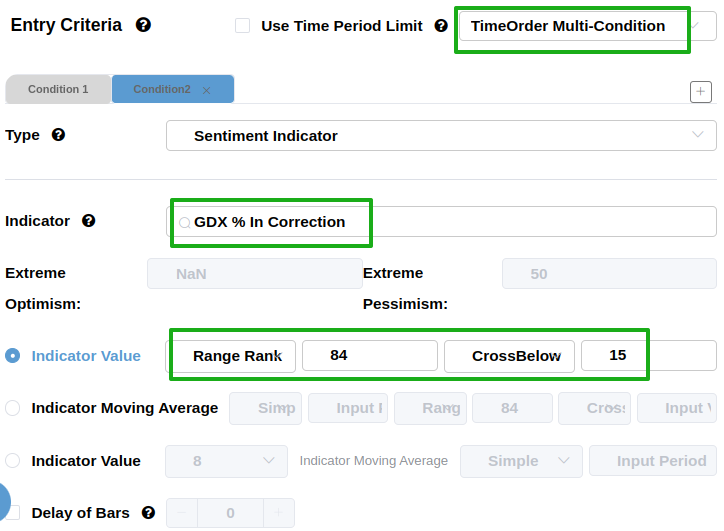
Then change the Time In Market from 21 to 63

Finally, click on the Run Backtest button.
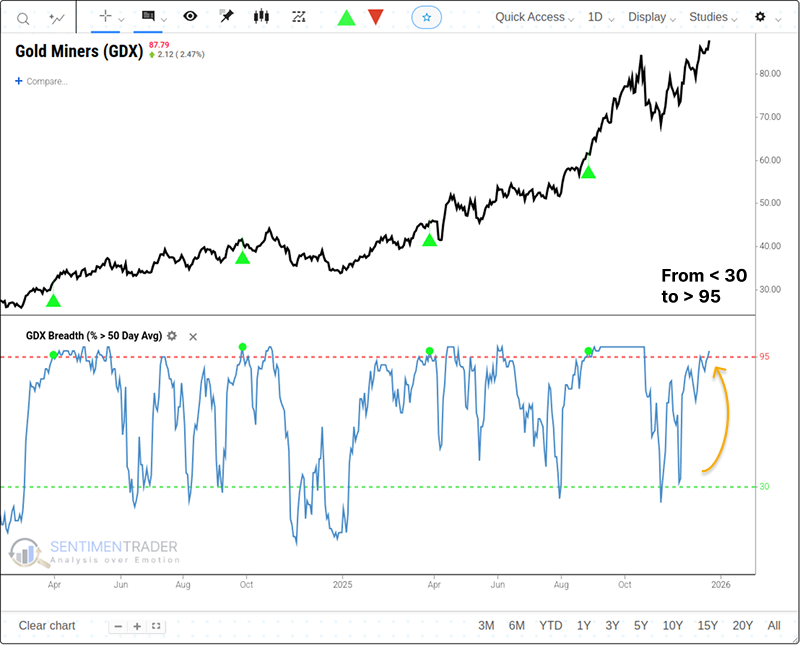
Breadth surge signals overheating
We note that another indicator-GDX Breadth (% > 50 Day Avg)-shows that the percentage of gold mining stocks trading above their 50-day moving average has surged from below 30% to over 95%. For the related backtest, click here.
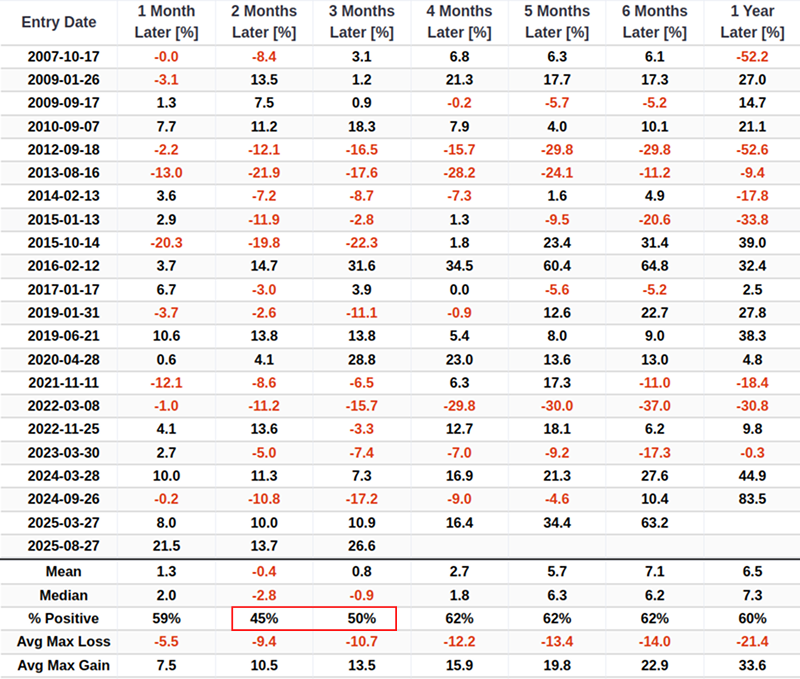
The table below illustrates why investors in this sector often struggle to generate consistent profits. Following such breadth surges, the GDX tends to exhibit weakening momentum over the subsequent two to three months.
You can explore other indicators regarding GDX on our website.
What the research tells us...
The Gold Miners (GDX) are currently enjoying a "Goldilocks" fundamental backdrop of rising gold prices and falling energy costs. However, technical evidence suggests the rally may be becoming extended. Internal breadth metrics show that almost no miners are currently in a correction, a condition that has paradoxically marked major tops in the past. Furthermore, the rapid surge in stocks above their 50-day average indicates an overheating of sentiment. While the long-term thesis may remain intact, historical data suggests that the sector is prone to fading momentum and potential drawdowns in the months immediately following such extremes.