
Is the gold breakout for real?

Key points
- Gold has broken out to a new all-time high (which is one of the most bullish things any security or market can do)
- At the same time, the Gold/SPX Ratio remains mired in a downtrend
- Likewise, gold is still technically in the unfavorable portion of the 8-year cycle
- While the bullish trend retains the benefit of the doubt as long as the price holds above the breakout point, the lack of confirmation may be a cause for concern if the breakout fails to hold
A new all-time high
One unwritten rule in trading is "never fade a new all-time high." Like most investing "rules," there are exceptions. But generally speaking, when a security initially breaks out to a new all-time high in price, it is better to go with the trend than to try to fight it.
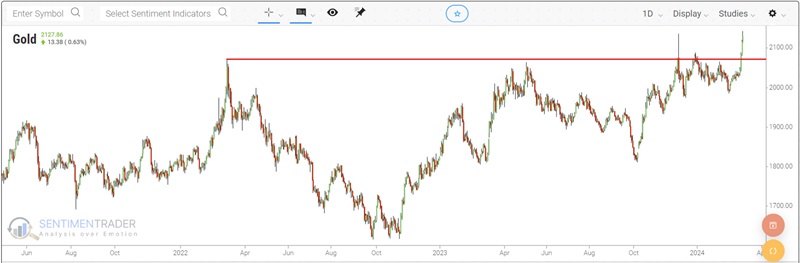
After trying literally for years to do so, gold recently punched above resistance and traded at a new all-time high price.
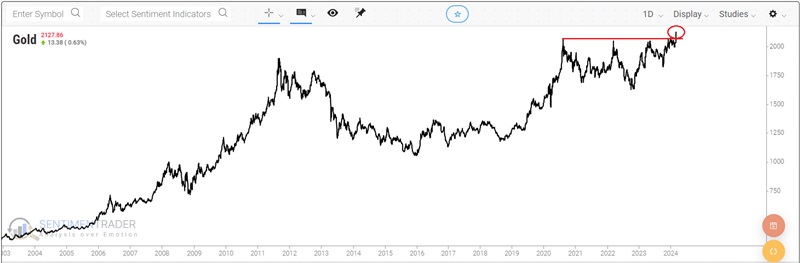
So, are we "off to the races?" Until proven otherwise, that is probably the way to bet. However, one helpful approach to trading is looking for "confirmation" of price action from typically reliable indicators. At the moment, there is a decided lack of confirmation among several historically useful trend and cyclical confirmation indicators. Does this imply that the breakout is doomed to fail? Not at all. But it implies that price action needs to be monitored closely - and that a breakdown below the breakout level could be a meaningful warning sign.
Still some reasons for concern
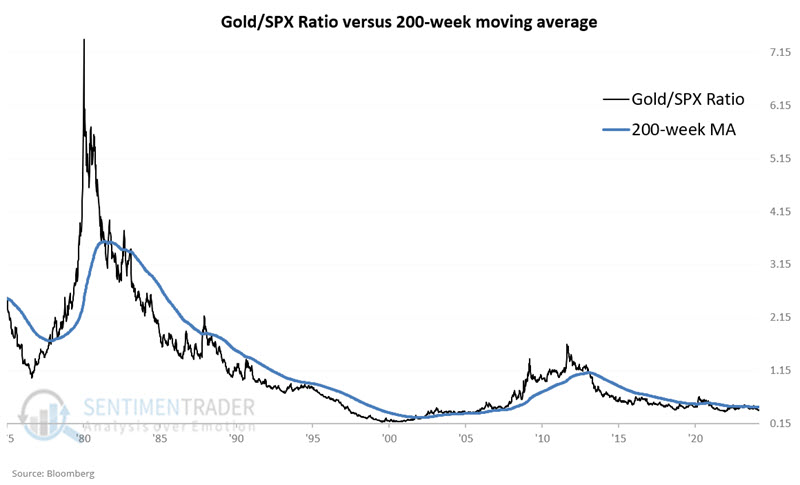
One typically reliable confirmation indicator is the Gold/S&P 500 ratio versus its 200-week moving average (which I first learned of from a gentleman and analyst named Mark Ungewitter). Ostensibly, when the ratio is above its 200-week average, it is considered favorable for gold and vice versa.
The chart below displays the Gold/SPX Ratio from 1975, with the 200-week moving average overlaid.
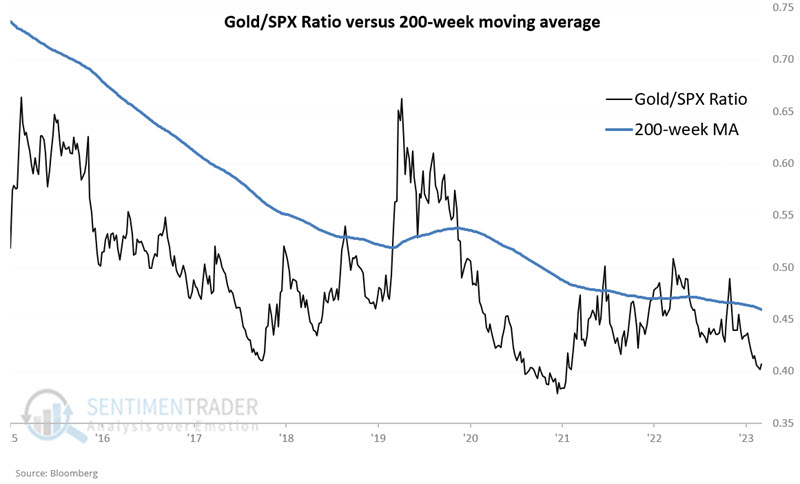
The chart below zooms in on recent action. As you can see, the ratio remains decidedly below its 200-week average - i.e., while this does not preclude the chance of gold running higher, we presently have to mark this confirmation tool as "not confirming."
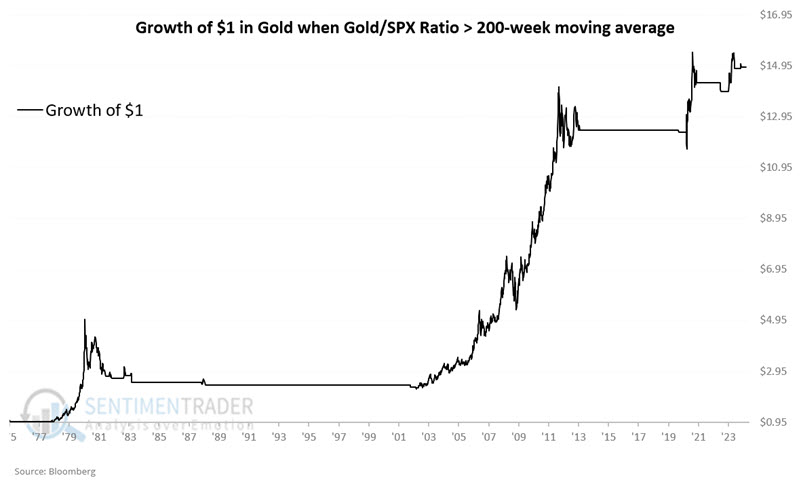
Historically, gold has performed much better when the indicator is positive. The chart below displays the hypothetical growth of $1 invested in gold only when the Gold/SPX Ratio is above its 200-week average. The hypothetical net gain since 1975 using this approach is +1,391%.
On the flip side, the chart below displays the hypothetical growth of $1 invested in gold only when the Gold/SPX Ratio is below its 200-week average (as it is now). The hypothetical net gain since 1975 using this approach is -21%.

As you can see in the chart above, an unfavorable indicator does not preclude gold from rising in price. But for now, this indicator remains "non-confirming."
The 8-year cycle doesn't bottom until the end of 2024
Cycles and seasonals are always secondary factors compared to actual price action (and any meaningful fundamental developments regarding a given security). The bottom line is that an "unfavorable cycle" or "unfavorable seasonal" trend should never be interpreted to mean that the security in question cannot rally. History also suggests that the more favorable factors evident at any point in time, the better the odds.
For many years, gold has operated on an 8-year cycle - 4 years favorable, followed by four years unfavorable. According to this analysis, gold has been in an "unfavorable" period since January 2021 and will remain so through December 2024. Then, a new "favorable" 4-year cycle will begin on January 1st of 2025 and last through the end of 2028.
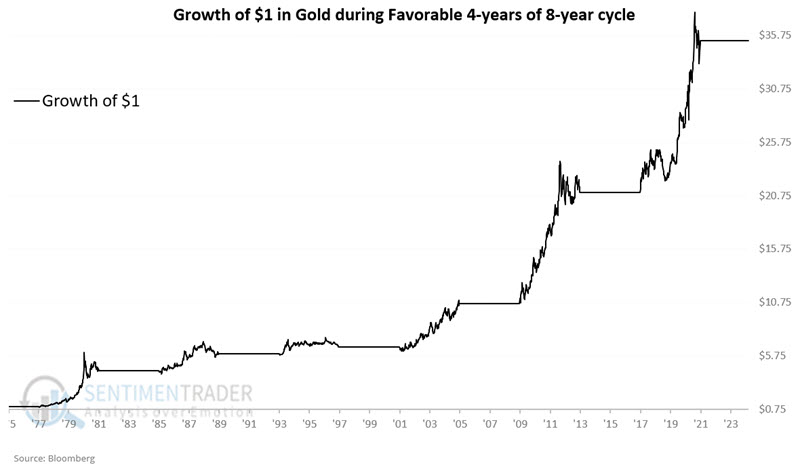
Does any of this matter regarding current price action? Maybe, maybe not. Still, consider the charts below. The first displays the hypothetical growth of $1 invested in gold only during favorable 4-year periods (the first began in January 1977 and lasted through December 1980). The cumulative gain is +3,431%.
The chart below displays the hypothetical growth of $1 invested in gold only during unfavorable 4-year periods (starting in 1975 and 1976, which technically were the last two years of the unfavorable 1973-1976 period). The cumulative loss is -68%. That said, it should still be noted that gold rallied significantly during the 2007-2010 unfavorable period. So again, cycles are "weight of the evidence" and NOT a trading system.
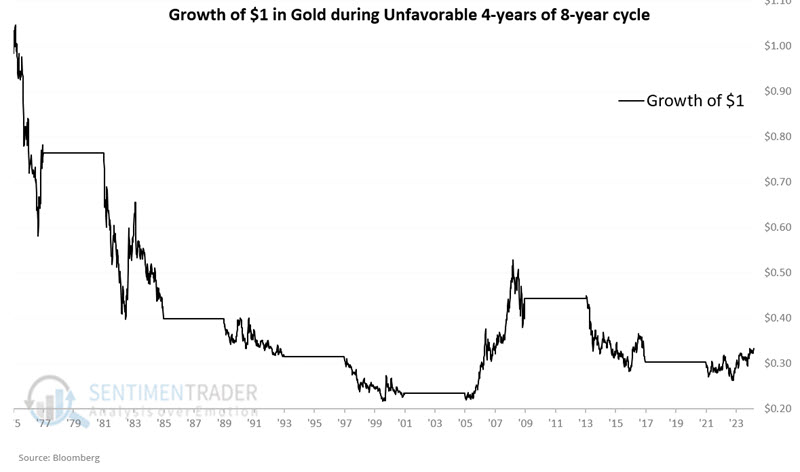
Once again, we must note in the chart above that gold can rally sharply despite an "unfavorable 4-year cycle," so no one should slavishly maintain a bearish stance on gold based solely on the calendar. Nevertheless, technically speaking, this cycle will remain "unfavorable" until the end of 2024.
Taking the two indicators together
So, at the moment, both of the indicators above are rated as "unfavorable." How concerned should we be? The chart below displays the hypothetical growth of $1 invested in gold only when:
- The Gold/SPX Ratio is below its 200-week moving average
- And the 8-year cycle is unfavorable

The cumulative return during these periods since 1975 is -74%.
The chart below displays the hypothetical growth of $1 invested in gold only when both indicators are favorable.
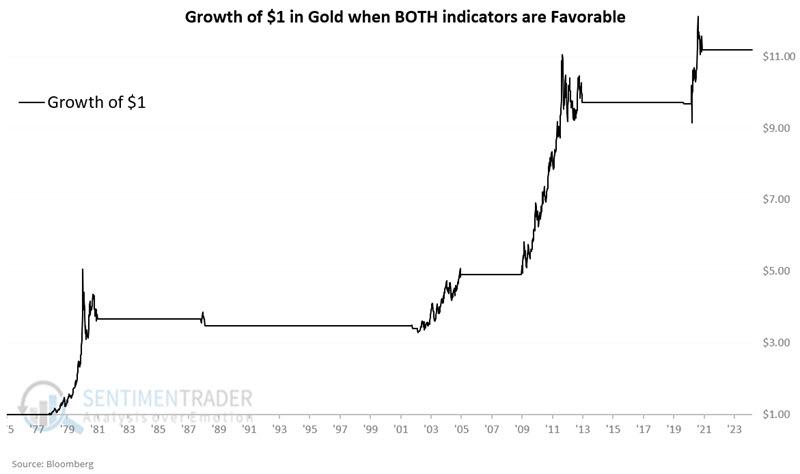
The cumulative return during these periods since 1975 is +1,019%.
What the research tells us…
The oldest adage in trading is "The trend is your friend." Currently, the trend for gold objectively has to be designated as "favorable." And with gold at a new all-time high, it may be dangerous to fade the trend. But the other question is, "How confident should we be that the uptrend will continue?" The confirming (or non-confirming, as the case may be) indicators detailed above do not inspire great confidence at the moment. If history is a guide, the current rally for gold may run out of steam. However, that is not a prediction - just words of caution.
Fortunately, the proper course of action for traders looking to play gold is pretty straightforward. As long as the price of gold holds above the recently pierced resistance level, seasonal and cyclical factors should be ignored, and the bullish case should be given the benefit of the doubt. However, if the breakout fails and gold falls below the breakout level, a much more cautious (or even outright bearish) stance might be in order.