
Is the dollar done?

Key Points
- Annual seasonality for the U.S. Dollar is entering an unfavorable period
- Sentiment for the U.S. Dollar has reached a level that has seen the dollar encounter trouble in the past
- On a more subjective, technical basis, the U.S. Dollar has also created a resistance level that may act as a "line in the sand"
Seasonality
The chart below displays the annual seasonal trend for U.S. Dollar futures.
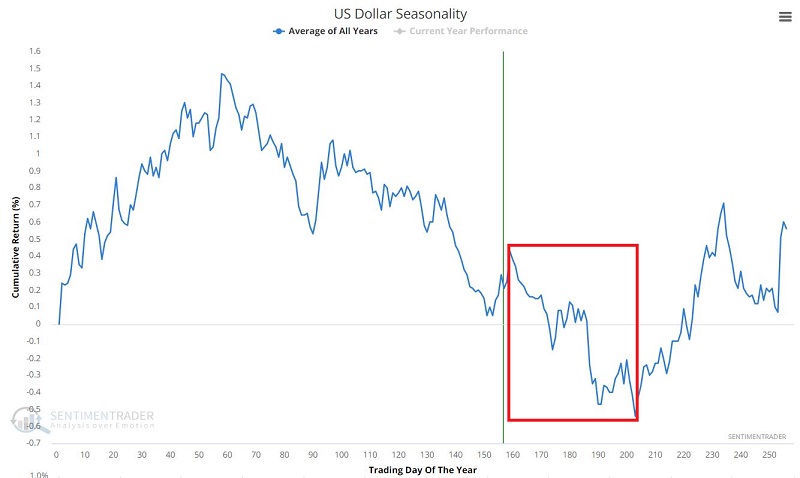
Note that the dollar is about to enter a seasonally unfavorable period that extends from the close on Trading Day of the Year (TDY) #159 through TDY #203. For 2022 this period extends from the close on 2022-08-11 through the close on 2022-10-13.
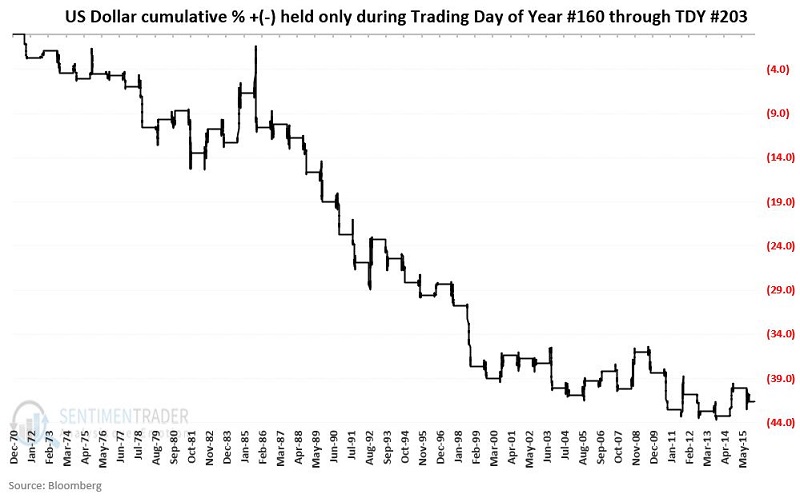
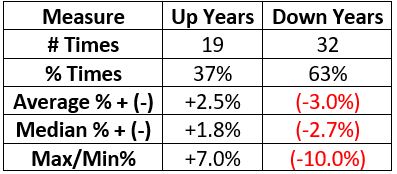
Does this guarantee that the dollar is headed lower in the months ahead? Not at all. Nevertheless, the chart below displays the cumulative % +(-) for the dollar if held long only during TDY #160 through TDY #203 every year since 1971. The table below the chart displays a summary of performance.
Sentiment
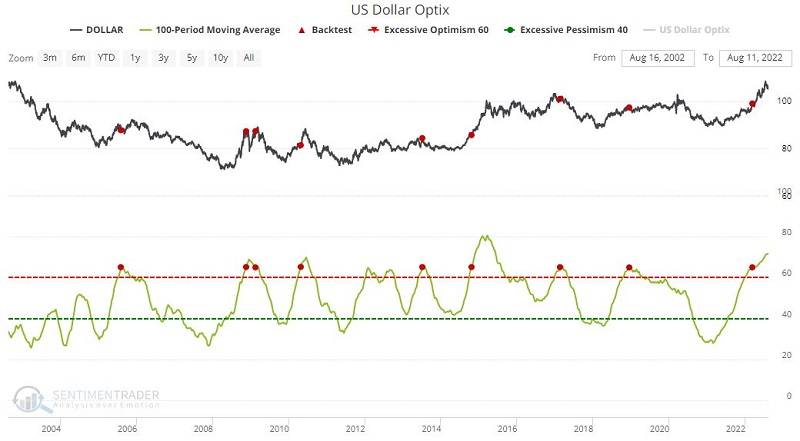
Now let's look at our Optix indicator for the U.S. Dollar. I follow three different iterations of this indicator because signals are typically infrequent; thus, there is a small sample size for each. Likewise, none of the three is head-and-shoulders better than the other two.
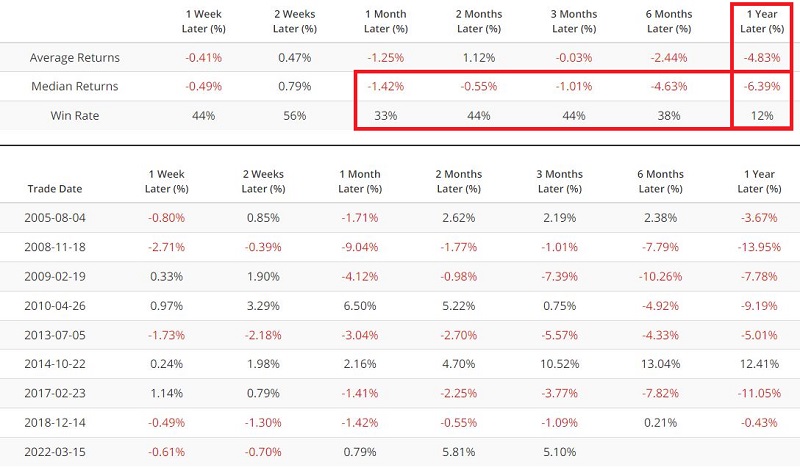
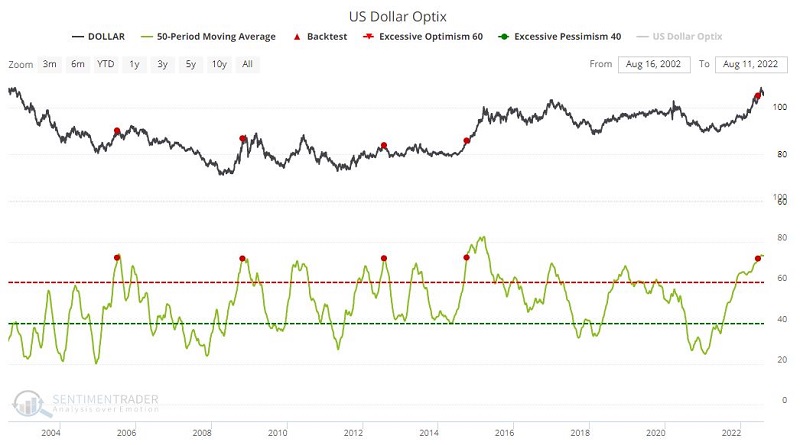
Optix measure #1: 100-day average crosses above 65: The chart and table below display those times when the 100-day average for U.S. Dollar Optix crossed above 65 and the dollar action over the next twelve months.
Optix measure #2: 50-day average crosses above 72: For a slightly different take, the chart and table below display those times when the 50-day average for U.S. Dollar Optix crossed above 72 and the action of the dollar over the next twelve months.
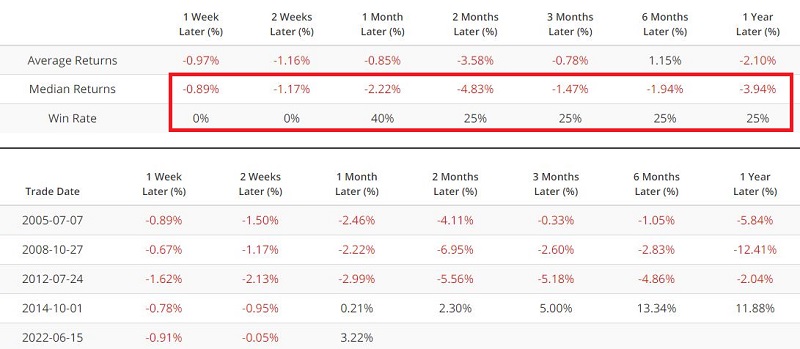
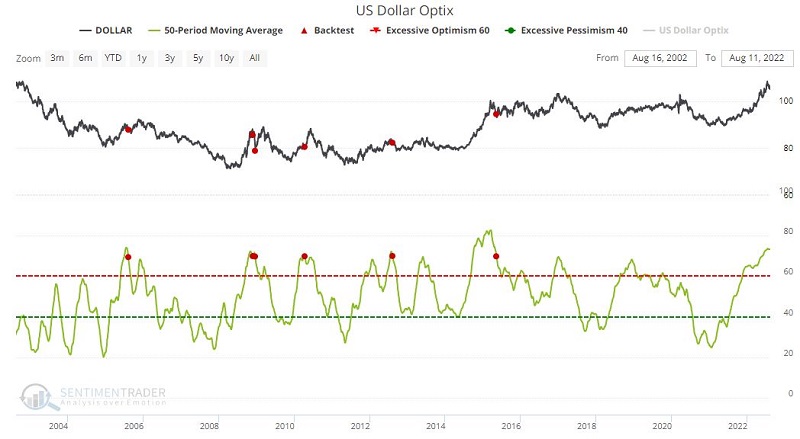
Optix measure #3: 50-day average crosses below 70: While the previous two iterations identify times when bullish sentiment is rising, this one looks for situations when bullish sentiment has peaked at a high level and is beginning to weaken. The chart and table below display those times when the 50-day average for U.S. Dollar Optix crossed below 70 and the dollar's action over the next twelve months.
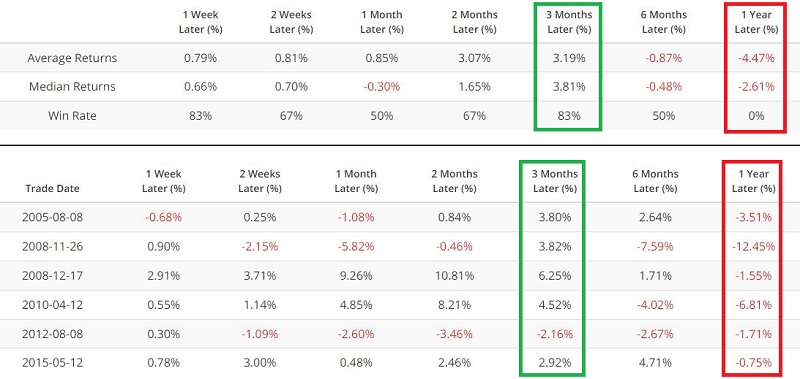
Interestingly, following this signal, three-month returns have been mostly positive, while twelve-month returns have been uniformly bearish. There may be some benefit to waiting three months to act following this signal.
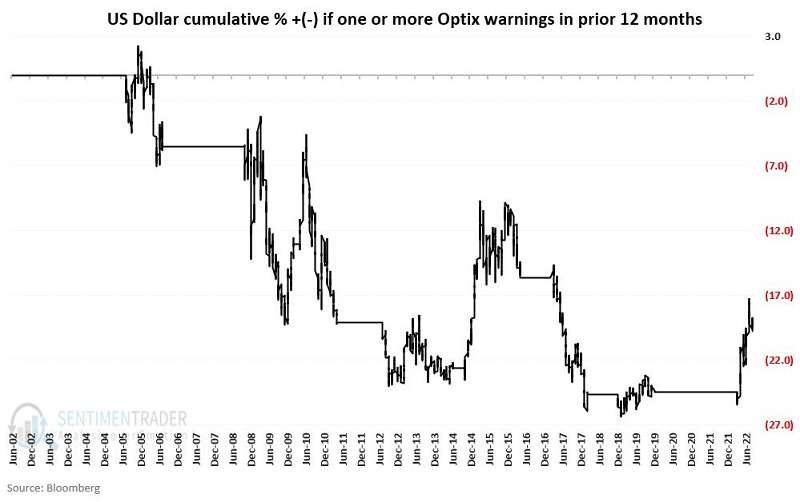
If any Optix signal has been triggered in the previous twelve months: The chart below displays the cumulative % + (-) for the U.S. Dollar only if any or all of the three Optix indicators detailed above gave a warning sign in the previous twelve months. The first two Optix measures described above gave warning signals on 3/15 and 6/15, respectively, and the dollar continued to rally. But the 6-month and 12-month historical returns shown suggest the potential for weakness months ahead - as do the results displayed in the chart below.
The dollar creates a resistance level
Lines drawn on a chart are always somewhat subjective. Nevertheless, I am slightly partial to horizontal lines, i.e., those that indicate a level where price (at least temporarily) stopped moving up (or down). The chart below (courtesy of StockCharts) displays a horizontal line drawn on a chart for ticker UUP (Invesco DB U.S. Dollar Index Bullish Fund), an ETF that attempts to track the price action of U.S. Dollar futures.
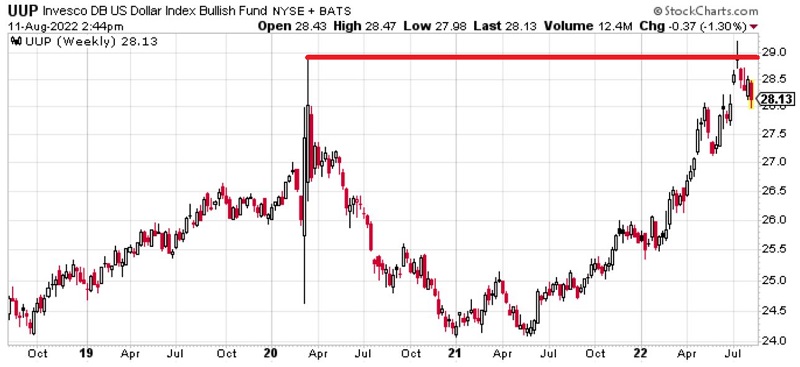
One can debate the price at which the horizontal line is drawn, but the point is straightforward. UUP recently attempted to breakout above a previously significant price-high and was rebuffed. The price must move above this line to higher new highs to re-establish an uptrend. As long as UUP remains below the previous high, the more the potential for weakness and lower prices - as suggested by the abovementioned indicators.
What the research tells us…
The dollar has been surprisingly strong in 2022 and could easily continue higher. If the dollar breaks out above the July highs any bearish bets are off. Still, when seasonality, sentiment, and price action agree, the odds are typically on that side of the market as things move forward. With an obvious level of overhead resistance, overly bullish sentiment, and an impending seasonally unfavorable period, it seems fair to ask if "the dollar is done" - even if just for a while.